
%%{init: {'theme':'base','flowchart':{'curve':'basis','wrappingWidth':320,'nodeSpacing':22,'rankSpacing':56},'themeVariables':{'fontFamily':'Inter, Helvetica Neue, Helvetica, Arial, sans-serif','fontSize':'17px','primaryColor':'#F4F6F8','primaryBorderColor':'#D9DEE4','primaryTextColor':'#2C3E50','lineColor':'#8A939C'}}}%%
flowchart LR
  Q["Why do only 15 of 120<br/>sign-ups use it weekly?"] --> A["Never activated<br/>(never joined a group)"]
  Q --> B["Activated, then left"]
  Q --> C["Still active"]
  A --> A1["Didn't understand what to do"]
  A --> A2["No group existed for their class"]
  B --> B1["Group never met"]
  B --> B2["Group met, wasn't useful"]
  B --> B3["Their need ended (exam passed)"]
  C --> C1["What do these 15 have in common?"]
  classDef question fill:#002E5D,stroke:#002E5D,color:#FFFFFF,font-weight:700
  classDef branch fill:#E6EEF7,stroke:#0057B8,stroke-width:2px,color:#002E5D,font-weight:600
  class Q question
  class A,B,C branch
Finding and Validating the Problem
Why This Matters
Building is cheap now, so the expensive mistake is building the wrong thing. Discovery reduces uncertainty before you spend weeks on an answer. Every idea you have rests on beliefs about other people: that they have this problem, that it hurts enough to change what they do, that they would use and pay for your fix. Discovery is the work of finding out which of those beliefs are true, cheaply, before you spend a sprint building on them.
Problem discovery is the process of moving from I think this is a problem to I know this is a problem worth solving. It requires talking to real people, asking the right questions, and turning what you hear into conclusions you can act on.
This is the longest chapter in the book because it covers the whole path from noticing a problem to deciding what to build first. The sections follow the order you do the work:
- Get the mindset. Treat your beliefs as guesses to check (Discovery Is Truth-Seeking, The Five Discovery Skills).
- Notice many problems. Start with your own frustrations and write them all down before you judge any (You Are Your Best First Customer through Diverge Before You Converge).
- Describe each problem precisely. Say what the person is trying to get done, how it hurts, and what they do about it today (Jobs-to-be-Done through The Real Competitor Is the Current Habit).
- Talk to people. Interview them about what they actually did, and sort what you hear by how much you can trust it (Problem Interviews through Interview Synthesis).
- Choose who it is for. Pick a narrow group you can reach (Who It Is For, and Not For through Building Personas).
- Score your problems and pick one (Evaluating Your Problems).
- Find what could make it fail, and test that first, cheaply (Issue Trees through The Smallest Test).
- Commit, and say what you offer (The Commitment Decision through Your Value Proposition).
- Decide the smallest first build (What is an MVP? through Feature Prioritization).
- Write the brief, and keep discovering (From Discovery to the Brief, Discovery Is Continuous).
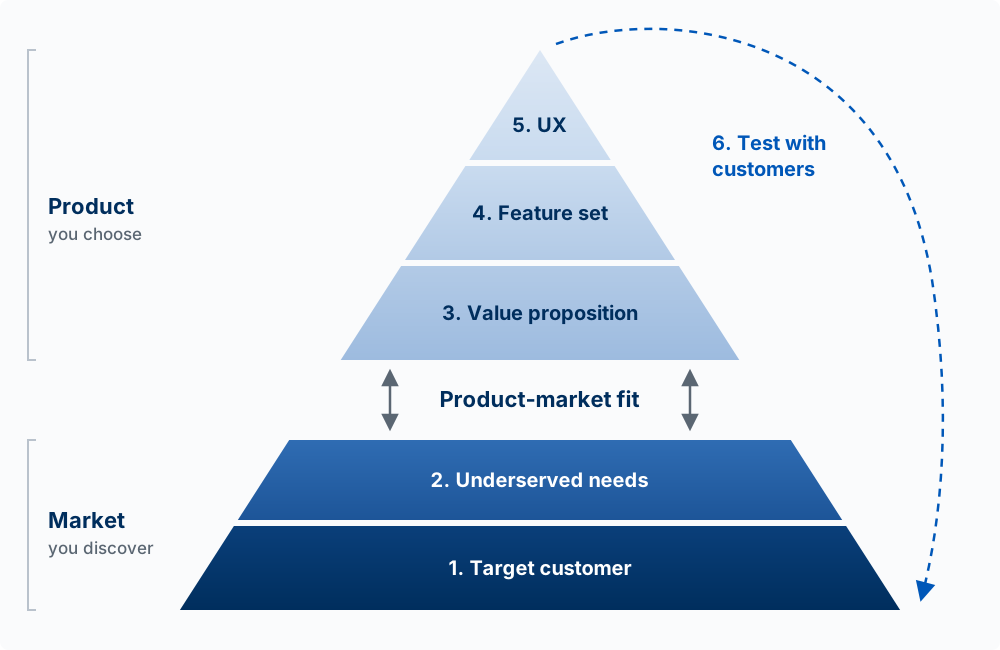
Dan Olsen’s Lean Product Process is a useful overview of the whole process. Product-market fit means you have built something that meets a real need of a real group of customers better than what they use now. The bottom two layers are the market and are not yours to decide: who the customer is and which of their needs are underserved. The top three are the product and are entirely your choices: the value proposition, the feature set, and the UX. Product-market fit is the boundary between them, and step 6 loops back through customer testing. This chapter is the bottom half. Chapters 5 and 6 are the top.
NoteThe example in this chapter: a dues tracker
A student club collects membership dues. Members pay the treasurer on Venmo, and every Sunday the treasurer matches those payments, one by one, against a sign-up sheet to see who still owes. A student builder thinks one page that shows who has paid would save that Sunday. This chapter follows the idea through discovery: what the treasurer does today, which assumptions would make it fail, and the smallest test that shows whether it is worth building. The example is invented for teaching.
Discovery Is Truth-Seeking
A product manager has one core job: to know what is actually true about a customer and their problem before spending real time and money building. Discovery is how you do that job. Everything else in this chapter, Jobs-to-be-Done, the Mom Test, interview synthesis, is a method for replacing what you believe about your users with what is true about them, as cheaply and quickly as possible. Steve Blank gave this discipline its name, customer development, and its motto: get out of the building (Blank 2005). The facts you need are outside, with real people, not inside your head.
It helps to see where a belief can sit.
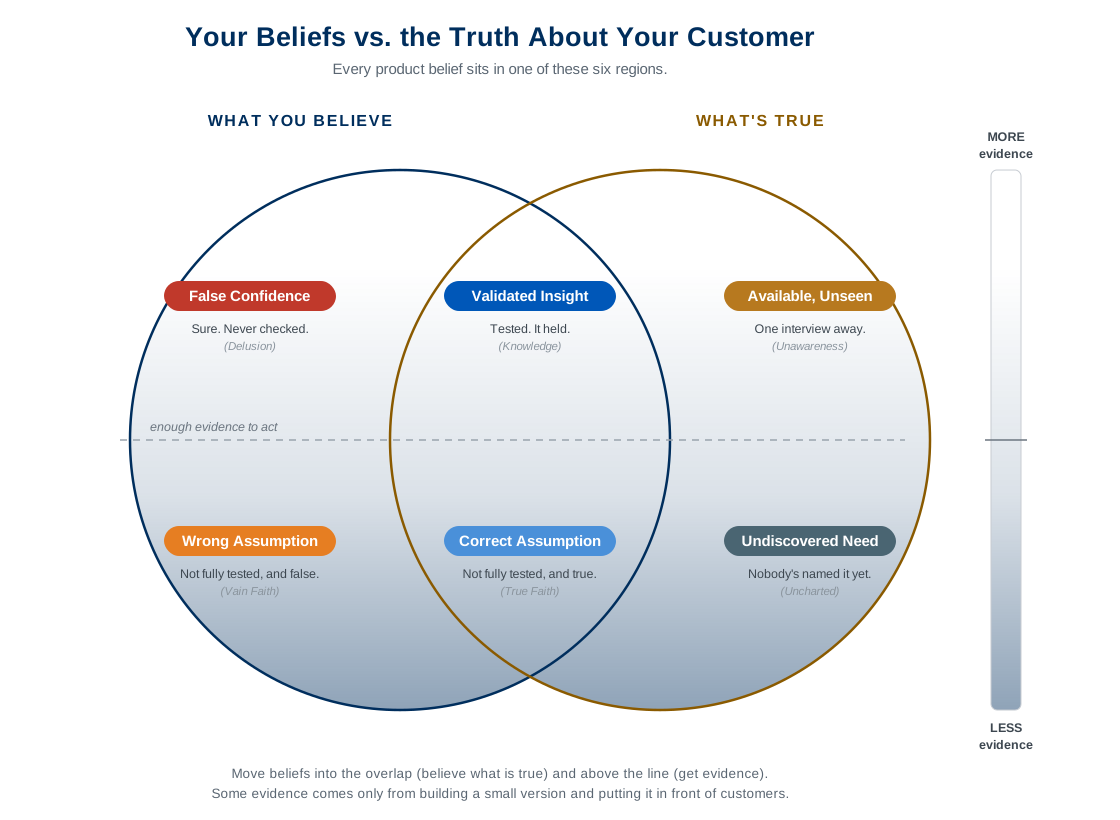
Those six regions each show up in real product work:
| Region | What it is in product terms |
|---|---|
| Validated Insight | True, and you have strong evidence. You believed it, you tested it, it held. This is what you want under your build plan before you commit. |
| Correct Assumption | You believe it, it is true, and the evidence is still thin. You cannot validate everything, so you will act on some of these. |
| Wrong Assumption | You believe it, it is not true, and the evidence is still thin. |
| False Confidence | You believe it, it is not true, and you feel sure. “I know users want this.” The most dangerous place to build from, because the certainty hides the mistake. |
| Available but Unseen | True, evidence exists, you have not gone to get it. A competitor already solved it, or a user would tell you in five minutes. |
| Undiscovered Need | True, but no one has evidence yet. The biggest opportunities and the biggest risks are both here. |
A correct assumption and a wrong assumption have the same evidence behind them, so from the inside they look the same. Only a test tells you which one you hold.
The work has three parts. Grow the overlap by making more of your beliefs true, which means discarding the false ones. Pull truths into it by going and finding what you do not yet know. And push your beliefs above the evidence line, from assumption toward validated insight, before you commit the semester to them. Get the evidence you can before you build. Some of it comes only from building: a small version in front of real customers is also a test.
Two failure modes account for most failed products. The first is building from False Confidence: shipping a thing you were sure about and never checked. The second is never leaving Available but Unseen: a truth was one interview away and you built on a guess instead.
Six ways of knowing, all flawed
If the map tells you where a belief sits, the next question is how you gather the evidence to move it. You have six tools, and every one of them can mislead you.
| Way of knowing | How a PM uses it | How it misleads you |
|---|---|---|
| Logical reasoning | Your own analysis, the internal logic of the idea | Armchair theorizing, confirmation bias. Seems airtight but has never been checked against a user. |
| Trial and error | Shipping a version, A/B tests (showing two versions to different users and comparing what they do), small experiments | Slow and costly, and you can optimize into a dead end. |
| Word of others | Competitors, analysts, “best practices,” the loudest stakeholder | Copying what worked for someone else without knowing why it worked. Their context is not your context. |
| Sensory experience | Watching real users, usability tests | Tiny samples, and people act differently when they know you are watching. You see what you expect. |
| Intuition | Product sense, taste | Your preferences are not your user’s preferences. |
| Epiphany | The insight in the shower | Feels convincing because it has not been tested. |
Because each tool fails in its own way, you triangulate: you treat a belief as validated only when independent sources converge, an interview, plus a behavior in the data, plus a test that passes. The most common mistake is trusting a single source, usually your own logic or one enthusiastic user, and promoting it straight to certainty. That leads to False Confidence.
How much evidence is enough depends on the stakes. A throwaway prototype needs almost none: go build it and learn. Committing the rest of the semester to one product needs a preponderance: real interviews, a customer who lives the problem, some signal they would pay. That is exactly what the conviction checks in the Problem Discovery Framework, which you use in Sprint 2, ask you to weigh (see Evaluating Your Problems). The posture throughout is to hold beliefs as probabilities: “I am maybe sixty percent sure” in place of “this is a great idea,” and let each conversation move the number.
NoteThinking in probabilities
This is the Bayesian habit, and it comes with one practical rule: good evidence is evidence that would look different if you were wrong. “Tell me about the last time you dealt with this” is strong evidence, because someone who does not really have the problem cannot answer it convincingly. “Would you use an app that does this?” is weak evidence, because people say yes whether the problem is real or not. Seek the evidence that actually moves the number; discount the flattery that does not. That single test is why the Mom Test works, and it is the logic behind the evidence ladder later in this chapter.
The rest of this chapter is the how. Jobs-to-be-Done gives you a sharper hypothesis about what is true. The Mom Test gathers evidence that actually moves the number instead of flattery that does not.
The Five Discovery Skills
Where do good problems come from? Jeff Dyer and his colleagues studied disruptive innovators and found that what sets them apart is behavior: they act in five particular ways, and those behaviors are mostly learnable (their research puts creativity at roughly one-third genetic, versus about four-fifths for raw IQ). The five skills:
- Questioning: repeatedly asking why, why not, and what if, keeping a high ratio of questions to answers.
- Observing: watching customers and their workarounds like an anthropologist, noticing what people actually do rather than what they say.
- Networking: talking with people whose perspective differs from yours, to borrow ideas from other fields.
- Experimenting: trying things, taking them apart, running small tests.
- Associating: the skill the other four feed, connecting the inputs from the other four into a new idea.
This whole course is a program for practicing these. Your problem journal is Questioning and Observing; the interviews later in this chapter are Observing and Networking; your prototypes and smallest tests are Experimenting. That is the point of the practice model, and it is Dyer’s finding too: these are skills you build with practice, and you are not born with them.
The five discovery skills are from Jeff Dyer, Hal Gregersen, and Clayton Christensen, “The Innovator’s DNA,” Harvard Business Review, December 2009. (Dyer et al. 2009)
You Are Your Best First Customer
You don’t necessarily need to conduct elaborate market research to find a problem worth solving. You’re surrounded by problems every day, and you just need to find one you are passionate about fixing.
Many of the best products come from founders who were frustrated by something in their own lives:
- Slack came from a gaming company’s internal communication frustrations
- Dropbox came from Drew Houston constantly forgetting his USB drive
- Airbnb came from founders who couldn’t afford their San Francisco rent
When you’re your own customer, you have three advantages:
- Faster feedback loops: You can test ideas immediately on yourself
- Authentic insight: You understand the problem’s nuances
- Built-in motivation: You actually want the solution to exist
The limit: you are one data point. Your own pain tells you the problem exists for at least one person. It does not tell you how many others share it, or whether they would switch to fix it. That is what the rest of the chapter is for.
Problem Journaling
Start keeping a problem journal. For the next week, write down every moment of friction, frustration, or inefficiency you experience. Don’t filter, just capture.
Ask yourself:
- What did I just waste time on?
- What task felt harder than it should be?
- What made me say “there has to be a better way”?
- What workaround did I create because existing tools failed me?
Your journal entries might look like:
- “Spent 20 minutes trying to split a dinner bill with friends because everyone uses different payment apps”
- “Had to manually copy data from one spreadsheet to another AGAIN”
- “Missed a package delivery because I didn’t know it was coming”
These small frustrations can become product ideas. Notice that each entry passes the stranger test from What Is Worth Building: it describes what happened, and none of them names an app.
Diverge Before You Converge
Good discovery follows an order: generate many options before you narrow. Generate many candidate problems before you judge any of them, then converge deliberately on the most promising. Most people do the opposite. They seize the first idea and spend months defending it, which is premature convergence.
So resist the urge to pick early. Your problem journal is the diverging half: capture dozens of frictions without filtering. Looking widely, across different people, contexts, and moments, surfaces problems you would never have reasoned your way to from your desk. Only once you have a long list do you start scoring and cutting (Evaluating Your Problems, below). The wider you diverge, the better the thing you eventually converge on.
Diverge/converge discipline adapted from Nile Hatch, Expeditionary Innovation. (Hatch, n.d.)
Jobs-to-be-Done Framework
The model: people do not want your product; they want progress in a specific situation, and they “hire” whatever gets them that progress. Describe the job without naming any product, and you have described the problem.
The Jobs-to-be-Done (JTBD) framework, popularized by Clayton Christensen (Christensen et al. 2016), shifts focus from what customers buy to why they buy it. The core insight: customers “hire” products to do a job.
The classic example is the milkshake (Christensen et al. 2016). A fast-food chain wanted to sell more milkshakes, so they improved the recipe. Sales didn’t rise. Then they asked a different question: What job are people hiring the milkshake to do?
They discovered that most milkshakes were bought in the morning by commuters. The “job” wasn’t enjoy a delicious treat. It was make my boring commute more interesting while keeping me full until lunch. The milkshake’s competition wasn’t other milkshakes; it was bananas, bagels, and donuts. The fix was to make it thicker (lasts longer), add fruit chunks (more interesting), and offer it at the drive-through (more convenient).
The JTBD Formula
Once you’ve identified a promising problem, frame it as a job:
When I’m [situation], I want to [motivation], so I can [desired outcome].
The building blocks: the situation is the trigger (when and where the job arises), the motivation is the progress the person wants, and the outcome is why that progress matters to them. The trap is the middle slot. “I want to” invites a feature (“I want to scan the receipt with my phone”). Write it as progress the person would recognize even if your product never existed. If the middle slot only makes sense to someone who has seen your app, rewrite it.
For example:
When I’m back from a work trip with a pocket full of receipts, I want to get reimbursed without losing an evening to it, so I can stop fronting the company money and put the trip behind me.
- When I’m planning a trip with friends, I want to settle on dates without a week of group-chat back-and-forth, so I can book before prices go up.
- When I’m starting a new exercise routine, I want to know what to do each day without researching it, so I can build strength without stalling out in week two.
- When I’m managing a team project, I want to know who is stuck before it costs us a deadline, so I can unblock them before deadlines slip.
This framing keeps you focused on the customer’s goal, not your solution. It reminds you that customers want progress in their lives. Your product is just a means to that end.
Three Types of Jobs
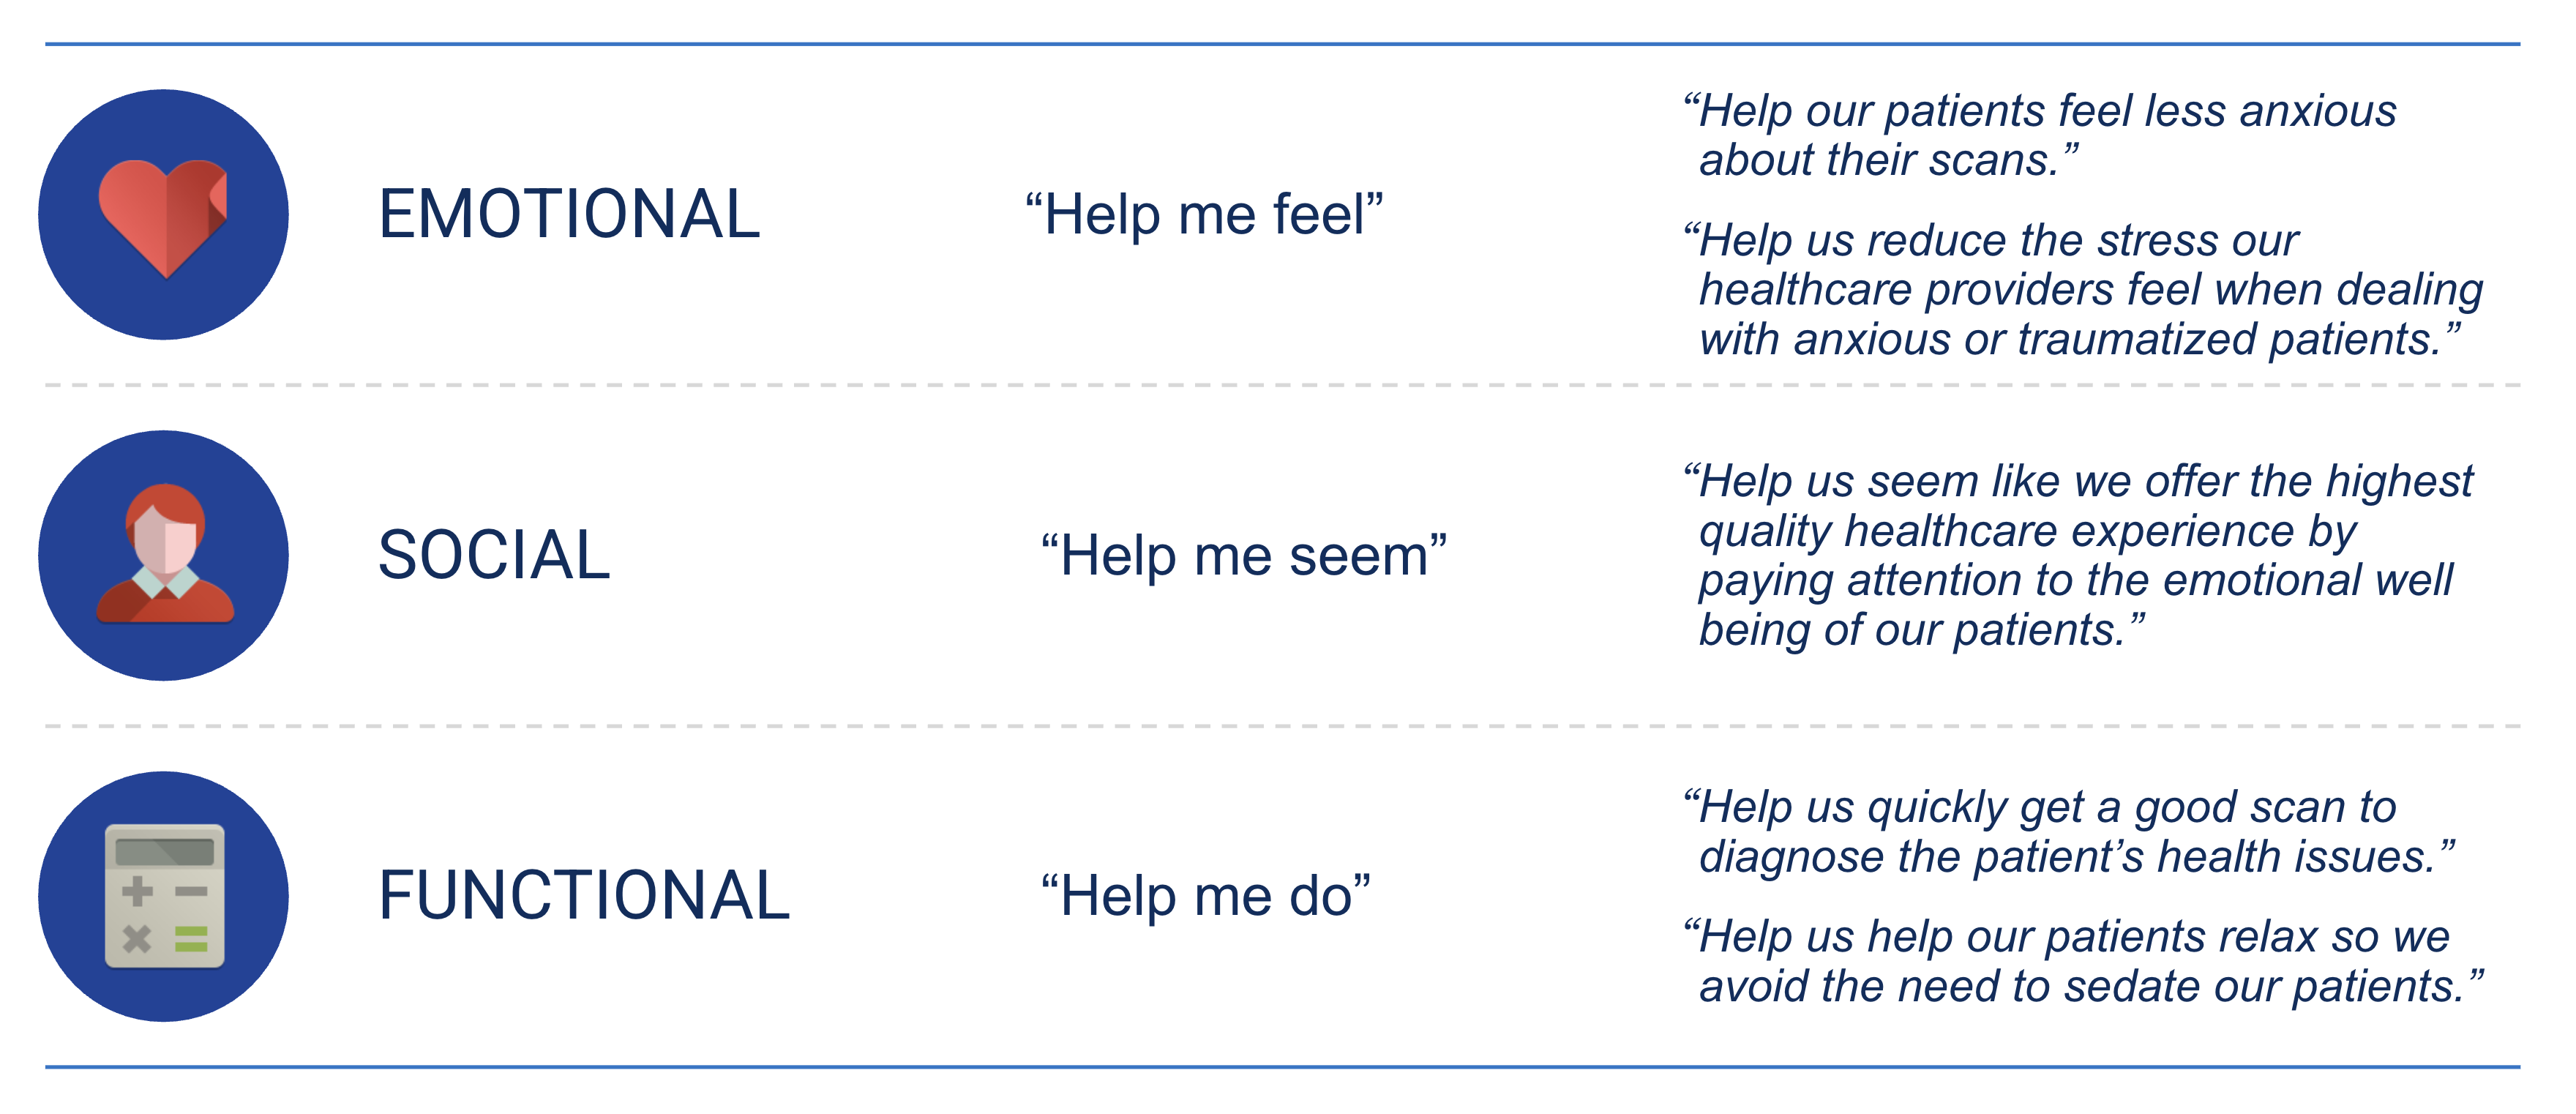
Every job has three dimensions:
| Job Type | Description | Example |
|---|---|---|
| Functional | What they want to accomplish | “Get from home to work” |
| Emotional | How they want to feel | “Feel in control of my day” |
| Social | How they want to be perceived | “Appear professional to colleagues” |
Most products focus only on functional jobs. But emotional and social jobs often drive purchasing decisions. Someone might buy a Tesla for the functional job (transportation) but the real motivation is social (appear environmentally conscious) or emotional (feel like an innovator).
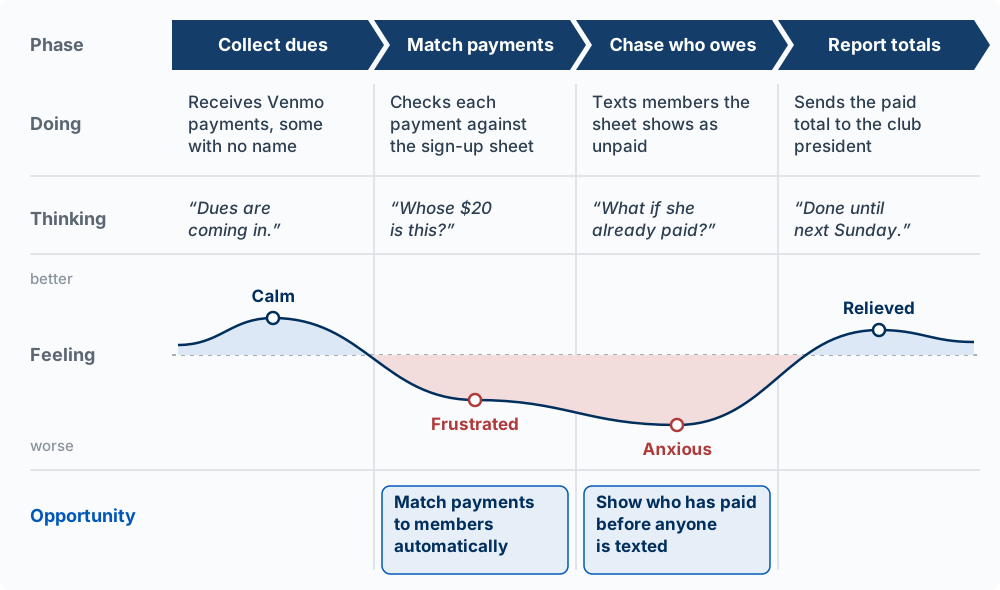
Map the whole job
A job rarely happens in one moment. Mapping the whole experience, phase by phase, shows you where the pain is greatest, which is usually not where you assumed. The dips are your opportunities.
TipTry it
Find the mistake in each job statement, then rewrite it:
- “When I’m studying, I want to use an AI flashcard generator, so I can learn faster.”
- “When I’m hungry, I want to eat, so I can not be hungry.”
- “When I’m running a club event, I want a Slack integration for RSVPs, so I can track attendance.”
(Hint: one names a product, one has a situation too vague to observe, and one names a feature where the progress should be.)
The Five Kinds of Pain
Jobs come in three types; the pain behind a job comes in five kinds, and naming them gives you a checklist of what to probe for. A single problem often hurts in more than one way:
| Kind of pain | What it costs the person |
|---|---|
| Physical | effort, fatigue, discomfort |
| Functional | time, steps, things that don’t work |
| Financial | money, waste, missed earnings |
| Emotional | stress, anxiety, embarrassment, frustration |
| Social | status, belonging, how others see them |
When you interview, listen across all five. The pains people mention first are usually functional; the ones that actually drive them to pay are often emotional or social. This complements the Self-Determination lens in Sprint 2 (autonomy, competence, relatedness): that lens explains why a pain matters; these five categories catalog how it hurts.
Five pain categories from Nile Hatch, Expeditionary Innovation (Hatch, n.d.).
The Real Competitor Is the Current Habit
The model: your main competitor is whatever the person does today: a spreadsheet, a group text, a paper list, or nothing at all. Switching away from it has a cost, so your product has to beat the habit by more than that cost.
The milkshake’s rival was a banana. Before anyone uses your app, they already get the job done somehow, and that way is free or already paid for, already learned, and already shared with everyone around them.
Bob Moesta, who worked with Christensen on the milkshake study, describes every switch as a contest between four forces (Moesta and Engle 2020):
| Force | Direction | Example: a student club tracking dues |
|---|---|---|
| Push of the current situation | toward switching | The treasurer spends Sunday matching Venmo payments to a sign-up sheet |
| Pull of the new solution | toward switching | One page that shows who has paid, updated automatically |
| Anxiety about the new solution | against switching | “What if it gets a payment wrong and I chase a member who already paid?” |
| Habit of the present | against switching | Everyone already Venmos the treasurer; the spreadsheet works, mostly |
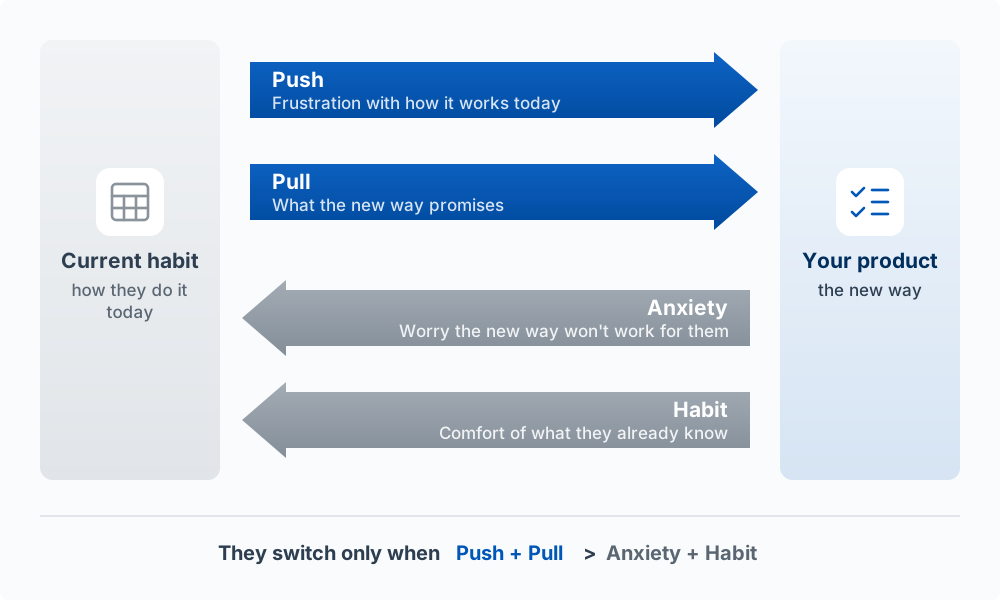
A person switches only when push plus pull outweighs anxiety plus habit. Most first products are all pull: the builder pictures the new thing and forgets how hard the old habit is to leave. The cost of switching is real: learning a new tool, moving data, getting others to change too, and the risk that the new tool fails at a bad moment.
This changes what you build and what you ask. In interviews, the question “What do you do today?” is as important as “What is hard?” In your value proposition (later in this chapter), the “Unlike” line should name the habit (“Unlike a Venmo feed and a spreadsheet”) before it names any startup. And when the honest answer to “what do you do today” is “nothing, and it’s fine,” the problem may not hurt enough to beat any habit.
TipTry it
For your current idea, write down (1) exactly what your target person does today, step by step, (2) what that habit costs them each week in time, money, or stress, and (3) every cost of switching to your product, including getting other people to switch. Then predict: is push plus pull larger than anxiety plus habit? Ask Claude to argue the side of the habit and see whether you still agree with your answer.
Problem Interviews (The Mom Test)
Once you have a hypothesis about the job customers are trying to do, you need to validate it with real conversations. This is where most people fail: they ask bad questions that produce misleading answers.
Rob Fitzpatrick’s book The Mom Test (Fitzpatrick 2013) identifies the core problem: if you tell your mom about your business idea, she’ll say it’s great. She loves you. She doesn’t want to hurt your feelings. And her feedback is useless.
The solution is to ask questions that even your mom couldn’t lie about, questions about their actual behavior, not hypothetical futures.
Rules of The Mom Test
- Talk about their life, not your idea
- Ask about specifics in the past, not generics about the future
- Talk less, listen more
Bad Questions vs. Good Questions
| Bad Question | Why It’s Bad | Good Question |
|---|---|---|
| “Would you use an app that does X?” | Hypothetical, everyone says yes | “Tell me about the last time you tried to do X” |
| “Do you think this is a good idea?” | Asking for opinions, not facts | “What solutions have you tried? What happened?” |
| “How much would you pay for this?” | They’ll guess to be nice | “What are you currently paying to solve this?” |
| “Would you recommend this to friends?” | Future promise, not behavior | “Have you ever told anyone about this problem?” |
The Most Useful Question
The most useful interview question is:
“Walk me through the last time you experienced this problem.”
This forces specificity. You’ll learn:
- How often it really happens
- What they actually did (not what they say they’d do)
- What emotions came up
- What solutions they tried
- Why existing solutions did not work
Signs You’re Onto Something
- They get animated or frustrated describing the problem
- They’ve already tried to solve it themselves
- They’ve spent money on partial solutions
- They take an action that costs them something: they sign up for your test, send you their real spreadsheet, or book a second conversation
- They introduce you to others with the same problem
Asking whether they can beta test (try an early version before it is public) is encouraging, but it is still something they said. It becomes evidence when they show up for the beta.
Signs You Should Pivot
To pivot is to change direction: drop this problem, or keep the person and look for a different problem they have.
- They can’t remember the last time this happened
- They shrug and say “it’s not a big deal”
- They’ve never tried to solve it
- They wouldn’t pay anything to make it go away
The Evidence Ladder: Said, Did, Paid
The model: what people said is weak evidence, what they did is stronger, and what they paid is strongest. Ask about the last time, not about someday.
Each rung is stronger because it costs the person more to fake. Saying “I’d use that” costs nothing, so people say it to be polite. Doing something costs time and effort. Paying costs money or reputation, which people guard.
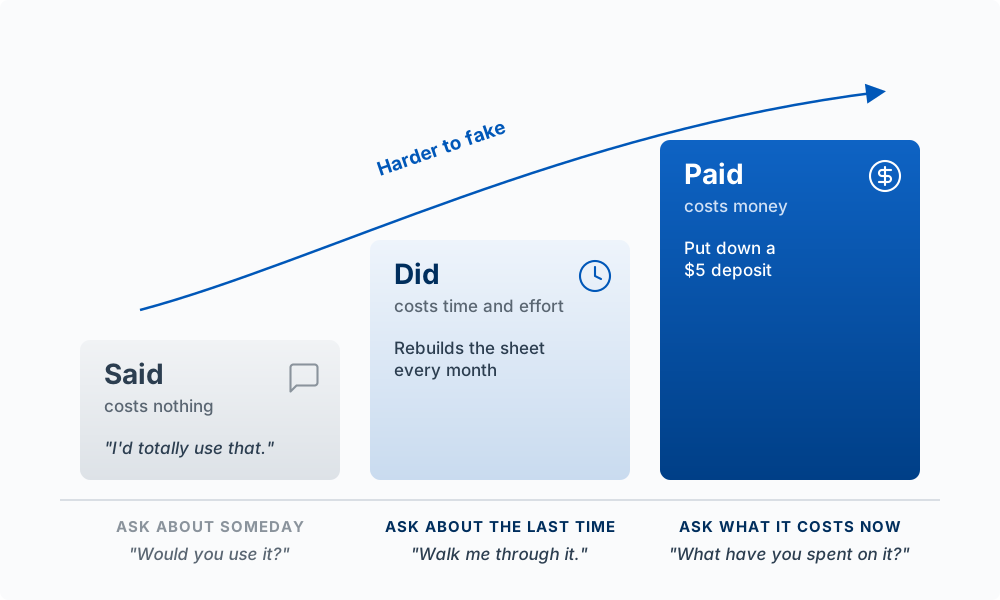
| Rung | What counts | Example | How it can still mislead you |
|---|---|---|---|
| Said | Opinions, compliments, predictions, “I would,” “I’d pay” | “That’s a great idea, I’d totally use it.” | Free to say, and people say it to be kind |
| Did | Past behavior and actions with a cost in time or effort: a workaround they built, hours they spend, a sign-up, an introduction, showing up | “Here’s the spreadsheet I rebuild every month.” / 40 people joined the waitlist | Doing something once does not mean they will do it again |
| Paid | Money changing hands, or a binding commitment: an existing purchase, a pre-order, a deposit, a budget line | “We pay $30 a month for a tool that half does this.” / 6 people paid a $5 deposit | A few early payers may not be your market |
Three rules follow from the ladder:
- The past is on the did rung; the future is on the said rung. “Walk me through the last time” asks for a report of what they did. “Would you use” asks for a prediction. That is why the Mom Test works. A story about the last time is still a story, so check it against an artifact when you can (“Can you show me the spreadsheet?”).
- Fitzpatrick’s currencies. In The Mom Test, commitment comes in time, reputation, and money (Fitzpatrick 2013). A second meeting is time; an introduction to their boss risks their reputation; a pre-order is money. Each is a step up from a compliment.
- Tag every claim by its rung. “Users want this” with only said-rung evidence is an assumption presented as an insight.
TipTry it
Tag each of these interview notes as said, did, or paid:
- “I’d definitely pay for something like this.”
- She showed you a Google Sheet with 14 tabs she maintains by hand.
- He asked if he could beta test it.
- Three people put down a $10 deposit on a pre-order page.
- “I hate doing this every week.”
- He forwarded your email to two friends who have the same problem.
Then go through your own interview synthesis and tag every key insight the same way. How many of your insights rest only on the said rung?
Conducting Effective Interviews
Before the Interview
- Define your hypotheses: What do you believe about the problem?
- Prepare 5-7 open-ended questions: Focus on behavior and specifics
- Target the right people: Those who actually experience the problem
- Set expectations: “I’m trying to understand how people handle X. Can I ask you some questions?”
During the Interview
- Shut up: You should talk less than 20% of the time
- Dig deeper: “Tell me more about that” / “Why was that frustrating?”
- Get specific: “Can you give me an example?” / “What happened next?”
- Watch for emotion: Strong feelings indicate strong needs
- Take notes: Or record with permission
Sample Interview Script
“I’m researching how people [handle X situation]. I’m not selling anything, I just want to understand your experience. Can I ask you some questions?”
- “Can you tell me about your role and what a typical day looks like?”
- “When was the last time you [experienced the problem]?”
- “Walk me through what happened.”
- “What did you do about it?”
- “What was frustrating about that?”
- “Have you tried any solutions? What happened?”
- “What have you spent on this so far, in money or time? What did you buy or try?”
Every question asks about the past. Question 7 replaces a hypothetical (“what would make this worth paying for?”) with the paid rung: what they have already spent is real willingness to pay. Close by asking for something small that costs them a little, such as “Who else should I talk to about this?” An introduction is a did.
Interview Synthesis
After 5+ interviews, patterns emerge. Synthesize what you learned into actionable insights.
NoteHow many interviews is enough?
There is no fixed number. The rule: stop when new interviews stop surprising you. Early on, every conversation adds something. As you approach saturation, you start hearing the same problems, quotes, and workarounds you have already heard, and the information each new interview adds drops toward zero. When two or three in a row tell you nothing new, you have enough to act. If every interview still surprises you, keep going; your sample is probably too narrow.
The saturation (“information entropy”) stop rule is from Nile Hatch, Expeditionary Innovation (Hatch, n.d.).
Synthesis Template
Use this format to document your findings:
Problem Statement: One clear sentence describing the problem you’ve validated. It should pass the stranger test.
Who You Talked To: Roles/titles of interviewees (not names, for privacy).
- 3 marketing managers at mid-size companies
- 2 freelance consultants
Key Insights: 3-5 bullet points summarizing the most important patterns, each tagged with its evidence rung.
- All 5 participants mentioned X as their biggest frustration (said)
- 4/5 have tried Y solution but found it lacking because Z (did)
- Time spent on this problem: average 3 hours/week (did, from their own walk-throughs)
Notable Quotes: Direct quotes that capture the emotion and specificity.
- “I literally dread Mondays because I know I’ll spend half the day on this.”
- “I’ve tried everything. Nothing actually works.”
What We Learned: Your interpretation and next steps.
- The problem is real and frequent (validated)
- Current solutions fail because they don’t address X
- Opportunity: build something that does Y
Who It Is For, and Not For
The model: a narrow first customer beats a broad market. And the person who uses the product and the person who pays for it may be different people.
Start narrow: the beachhead
Geoffrey Moore’s advice for new products is to win one narrow segment completely before expanding: a beachhead, a small market you can dominate and use as a base to move outward (Moore 1991). A narrow segment works better early, for three reasons. People in a narrow segment share the same habit, so one product can beat it. They talk to each other, so word spreads. And you can reach all of them, so you learn fast. For a student, a beachhead might be one dorm, one club, or one kind of small business in Provo. Ten people who love it teach you more than a thousand who are indifferent.
Say who it is not for, too. “Not for clubs with more than 200 members, not for clubs that collect dues by check” is a decision that keeps you from trying to build for everyone and serving no one well.
The user and the payer
In many products, the person who uses it is not the person who pays.
| Product | User | Payer |
|---|---|---|
| A teen driving app | the teen | the parent |
| Analytics software at a company | the analyst | the manager who owns the budget |
| A classroom tool | the students | the instructor or the school |
| Club dues tracker | the treasurer (and members, who pay dues through it) | the club, from its budget, if anyone |
Each has a different job and a different habit. The user cares whether it is easy (usability); the payer cares whether it is worth the money (value and viability). If they differ, you need evidence from both, and your interview list should include both.
TipTry it
Write your target customer as narrowly as you can in one sentence, then list three people who are not your customer even though they might be interested. Then name the user and the payer. If they are different people, have you interviewed the payer? If not, who is the first payer you could talk to this week?
Can You Reach Them? The Access Test
A real, painful, frequent problem is still not an opportunity if you cannot reach the people who have it. Before you commit, run a quick access test on three questions:
- Location. Can you find where these people already gather, online or off? If you cannot name the channel, that is a warning sign.
- Engagement. Will they actually respond to you, answer questions, and try a prototype?
- Reciprocity. Do you have something to offer in return? Reaching people is not enough. People give you their time when the exchange feels fair.
If you cannot reach a segment cheaply now, as a student, you will not reach them cheaply as a founder. Either find a reachable beachhead within the market or reconsider the problem.
The access test is adapted from Nile Hatch, Expeditionary Innovation. (Hatch, n.d.)
Building Personas
A persona is a fictional but realistic representation of your target customer. It synthesizes interview data into a memorable character that keeps your team aligned.
A worked example, from Dan Olsen:
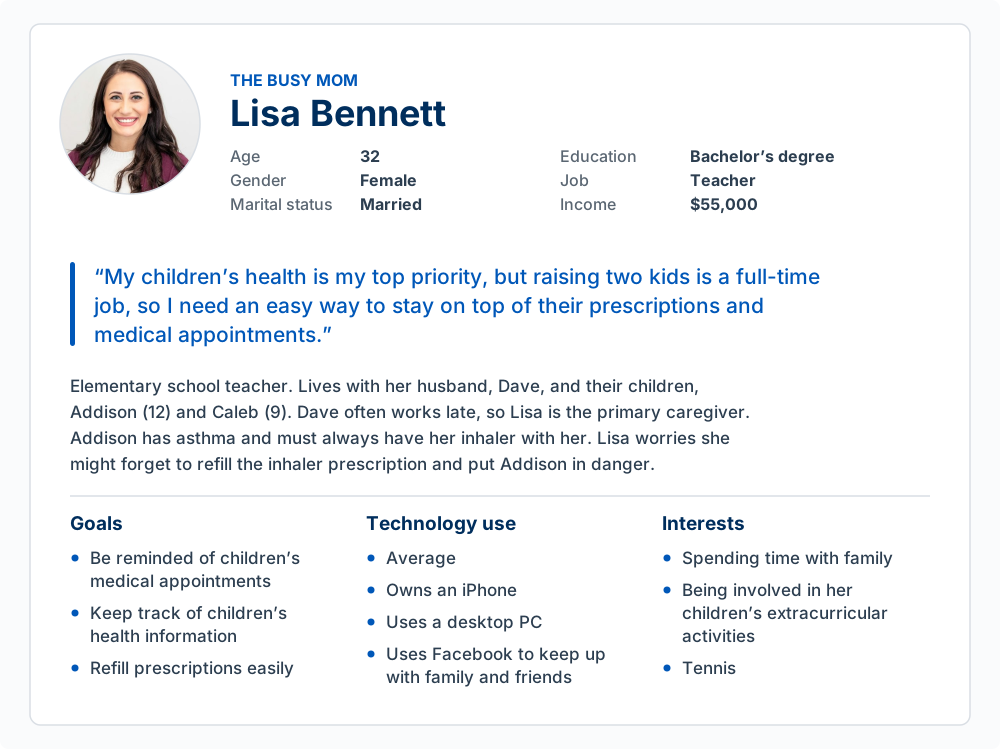
Note what makes this one useful: the quote and the asthma inhaler come from a real interview, not from imagination. A persona is a summary of evidence you already collected. The failure mode, and it is the easy one now, is asking an agent to generate a persona before you have talked to anyone. That produces a plausible character with no information in it, and it will confirm whatever you already believed.
Persona Template
Name & Role: Sarah, 34, Marketing Manager at a 200-person SaaS company (Software as a Service: a company that sells software by monthly subscription)
Demographics:
- 5 years in role, manages team of 3
- Based in Austin, works hybrid
- Comfortable with technology but not technical
Goals/Motivations:
- Ship campaigns on time
- Prove marketing’s impact to leadership
- Get promoted to Director within 2 years
Frustrations/Pain Points:
- Spends 6+ hours/week manually compiling reports
- Can never get real-time data when executives ask
- Marketing tools don’t share data with each other
Job-to-be-Done:
When I’m preparing for our weekly leadership meeting, I want to answer any question about campaign performance on the spot, so I can confidently demonstrate marketing’s value.
Current Solutions & Workarounds (the habit to beat):
- Manually exports data from 4 different tools into a spreadsheet
- Has built elaborate formulas that break constantly
- Sometimes just estimates because accurate data takes too long
Willingness to Pay: Has budget authority up to $500/month for tools that save significant time. (Here the user is also the payer. When she is not, write a second, shorter profile for the payer.)
Evaluating Your Problems
Not every problem is worth solving. Once you have a pile of candidates and some interviews, you score them. The course uses one rubric, the one in the Problem Discovery Framework you use in Sprint 2. Its parts:
| Factor | Question to ask | What strong looks like |
|---|---|---|
| Frequency | How often does this problem occur? | Daily or weekly; yearly is weak |
| Intensity | How painful is it when it happens? | “I hate this,” and they have already tried to fix it |
| Willingness to Pay | Would someone pay to make this go away? | They already pay for partial solutions (the paid rung) |
| Market Size | How many people have this? | A segment you can name and reach, beyond you and your friends |
| Your fit (conviction) | Do you live it, love someone who does, or see something others miss? | Two or more of the four conviction checks |
| Addressability (technical feasibility) | Can software actually solve this, with data and tools you can get? | Data access, technology ready, no hardware or regulatory blockers |
The first four are scored 1 to 5 (the Opportunity Score); conviction and feasibility are checklists. The full scales are in the framework appendix.
A problem that happens rarely but is extremely painful (like planning a wedding) can be worth solving. A problem that happens constantly but is mildly annoying (like seeing ads) can also be worth solving. The strongest case is frequent AND painful AND people will pay.
Frequency and intensity
Problems that occur frequently create more value when solved: a tool that saves someone 10 minutes daily is worth more than one that saves an hour yearly. Red flag: if interviewees can’t remember the last time it happened, frequency is too low. Intensity measures how much the problem disrupts someone’s life or work, and high intensity creates the urgency that beats a habit. The signs are the ones under Signs You’re Onto Something: strong emotional language, workarounds they built, a problem they raise unprompted. Low intensity sounds like “it’s annoying but not a big deal” from someone who has never tried to fix it.
Willingness to Pay
The strongest validation is whether someone will exchange money to make this problem go away. This is harder to assess than frequency or intensity, but it’s the most important. Score it from the highest rung of the evidence ladder you actually have.
Strong signals (did and paid):
- They’re already paying for partial solutions
- They can show you what the problem costs them (“This costs me $X per month,” backed by a bill or a timesheet)
- They pay a deposit or pre-order when offered
- They spend real time on workarounds every week
Weak signals (said):
- “Yeah, I’d probably pay for that” (hypothetical)
- “That sounds like a good idea” (opinion, not commitment)
- They ask about pricing but take no step when offered one
- They have no budget authority for this type of purchase
TipStrengthen your evidence
Three ways to keep your scores honest:
- Quantify willingness to pay from what they already spend. Do not ask for a number they will invent. Add up what the problem actually costs them today: the price of the workaround, the hours lost, the substitute they already buy. That is real willingness to pay.
- Score intensity out of ten (the “Ouch Factor”). Force yourself to rate how much it hurts, 1 to 10, per person. Vague intensity hides weak opportunities.
- Watch both failure modes. A false positive is polite agreement (“sure, I’d use that”) for a problem no one really has. A false negative is a real pain you missed because you framed the question badly. Seek disconfirming evidence for the first; re-ask in different words to catch the second.
Ouch Factor, workaround-spend, and false-positive/negative framing from Nile Hatch, Expeditionary Innovation. (Hatch, n.d.)
Another lens: importance and satisfaction
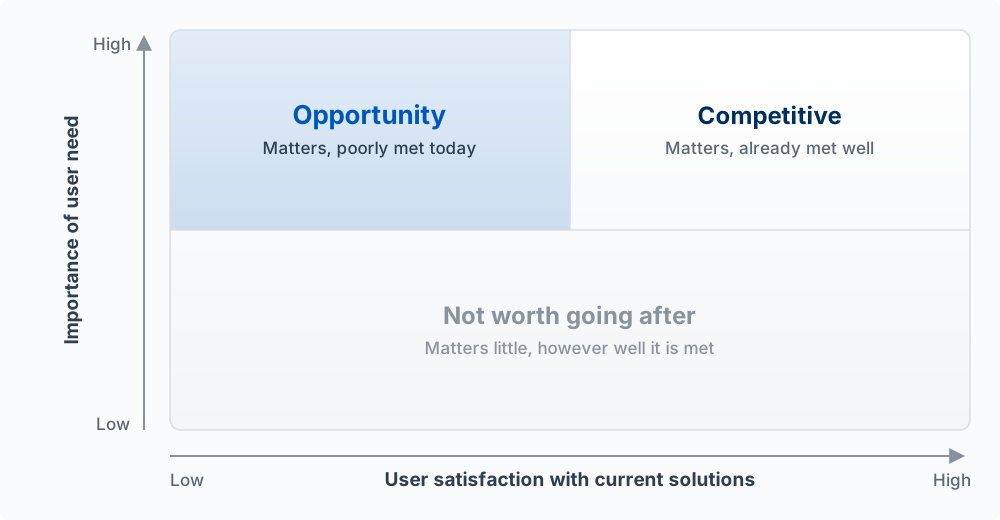
Dan Olsen’s Lean Product Playbook (Olsen 2015) adds a second view that the scorecard misses: how well people’s needs are already met. Plot potential problems on a 2x2 matrix:
- Y-axis: Importance: How much does this matter to the customer?
- X-axis: Satisfaction: How well do current solutions address it?
The opportunity zone is high importance + low satisfaction. These are problems that matter a lot to people but that they can’t solve well today. High importance with high satisfaction means the current habit already does the job, and you would have to beat it.
Structure a Messy Problem: Issue Trees
The model: break a big question into parts that do not overlap and leave nothing out, then work the part that decides the answer.
Discovery questions are often messy: “Is this worth building?” “Why aren’t people using my app?” Consultants handle messy questions with a short sequence of steps, and the steps apply directly to product work. They also set up the next section: the impact and uncertainty test in building block 3 is how you will pick your riskiest assumption. This section adapts them from the Management Consulting course (STRAT 325, chapter 5, Structured Problem-Solving, sections 1.5 to 1.8).
Building block 1: MECE
MECE (pronounced “mee-see”) means mutually exclusive, collectively exhaustive. A list of parts is MECE when no two parts overlap (each case falls in exactly one) and together they cover every case (nothing falls outside). Barbara Minto developed and popularized the idea at McKinsey as part of the Pyramid Principle (Minto 1978).
Overlapping parts count the same cause twice; a gap can hide the real answer.
Structures that are MECE by construction are the safest, because the math guarantees it:
- Revenue = Price × Volume
- Profit = Revenue − Costs
- Users = Never activated + Activated and left + Still active
- Options = Do nothing, Do X, Do Y
Building block 2: the issue tree
An issue tree applies MECE at each level. The top is your question. Each branch splits it into MECE parts, and each part splits again until every leaf is something you can check with evidence.
A worked example. You launched a study-group finder; 120 students signed up and 15 used it last week. Why is retention low?
The tree changes what you do next. The instinct is “add features.” With the tree, you check the data first: if 90 of the 105 missing users never joined a group, the problem is in the first branch (onboarding or empty classes), and no feature for active groups will help.
Building block 3: prioritize by decision impact
Not every branch deserves work. Rank them on three questions from the consulting version:
- Impact: if we are wrong about this branch, does it change what we build?
- Uncertainty: how confident are we already?
- Testability: can we actually check it this sprint?
Work first on the branch that is high impact, high uncertainty, and testable.
Building block 4: exclude what does not decide
The “so what” test: for any question you could investigate, ask “if I knew the answer, would it change what I build?” If not, skip it and say so. Students often spend a week on market-size research for a product whose real open question is whether ten people will use it twice.
TipTry it
Two drills.
- Find the MECE mistake: “Why are users leaving? (a) the app is slow, (b) they’re on Android,
- they found it confusing, (d) bugs.” Which parts overlap, and what is missing? Redraw it using a structure that is MECE by construction.
- Draw an issue tree for one open question about your own product, three levels deep. Mark the one leaf that, if answered, would most change your next sprint. Ask Claude to check your tree for overlaps and gaps, then decide yourself whether it is right.
The Four Risks and the Riskiest Assumption
The model: every product idea can fail in four ways: they don’t want it, they can’t use it, we can’t build it, or it doesn’t work as a business. Name the assumption most likely to make it fail and test it first.
What would have to be true
Start with the consulting move from section 1.5 of Structured Problem-Solving: state your idea as a hypothesis, then ask “What would have to be true?” for it to work. The question comes from Roger Martin’s strategy practice, and it appears in Playing to Win (Lafley and Martin 2013). It turns a vague belief (“this is a good idea”) into a list of specific conditions, each of which you can test.
The four risks: a MECE list of what could be false
Marty Cagan sorts everything that has to be true into four risks (Cagan 2017):
| Risk | The question | A cheap test |
|---|---|---|
| Value | Will they want it, enough to switch from the current habit and pay? | Interviews about the last time; a smoke test; a presell (both defined in The Smallest Test) |
| Usability | Can they figure out how to use it? | Put a clickable prototype in front of five users and watch (Testing the Design) |
| Feasibility | Can we build it with the time, skills, data, and tools we have? | Ask Claude to build only the hardest piece in an hour (a spike) |
| Viability | Does it work as a business: someone pays, costs stay below price, it is legal and allowed? | Price it in a presell; estimate cost per user (including what the AI company charges each time your app sends it a request); check the rules |
These four are a MECE split of “will this product work?”: a failure in any one is enough to make it fail. Cagan’s point is that teams over-test feasibility and under-test value, which is the risk most often wrong. AI makes this worse: an agent can resolve feasibility risk for an ordinary app in an afternoon, and a working app is easy to mistake for proof of value. It only proves you could build it.
The riskiest assumption
Your riskiest assumption is the condition that is both most uncertain and most fatal if false (the impact and uncertainty test from the issue-tree section). Test it before anything else, because every hour spent on other parts is wasted if it fails.
A worked example. Idea: a dues tracker for student club treasurers.
| What would have to be true | Risk | Uncertainty | Fatal if false? |
|---|---|---|---|
| Treasurers find matching payments to members painful enough to switch | Value | High (we’ve talked to two) | Yes |
| Treasurers can connect their Venmo history to the app | Feasibility | High (Venmo closed its API, the connection other apps use to read its data, to new developers in 2016; members can download a monthly CSV statement) | Yes |
| Treasurers can learn it in under five minutes | Usability | Medium | No, fixable |
| A club will pay $5 a month | Viability | High | Not this semester; a free tool is fine for now |
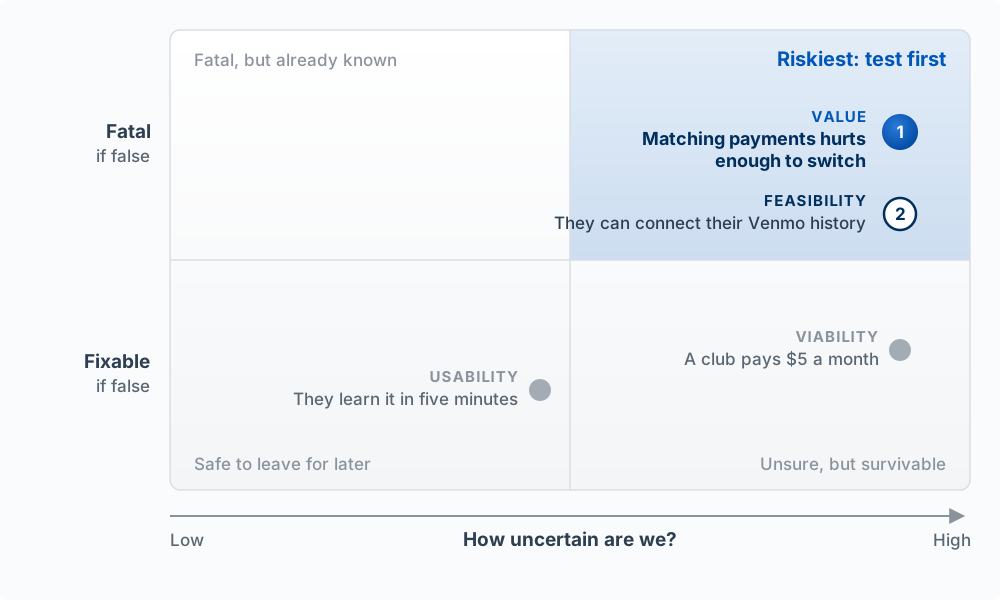
Two assumptions are high-uncertainty and fatal: value and the Venmo data. Value comes first, because if treasurers don’t care, the data question never matters. But the feasibility one is cheap to check (an hour of reading and a spike) and could rule out the idea in its current form, so check it the same week.
TipTry it
For your product, write the hypothesis in one sentence, then list five things that would have to be true. Label each with its risk (value, usability, feasibility, viability), its uncertainty, and whether it is fatal. Circle your riskiest assumption. Then write one line you could paste into your sprint plan: “My riskiest assumption is , and this sprint I will test it by .”
The Smallest Test
The model: before you build, fake it, do it by hand, or sell it first. The goal is learning per hour: the most trustworthy evidence about your riskiest assumption, for the fewest hours.
Once you know your riskiest assumption, you can usually test it faster and cheaper than writing the product. These are the classic tests, ordered roughly from least to most effort:
| Test | What you do | Risk it tests | Evidence rung |
|---|---|---|---|
| Smoke test | Offer a product that does not exist yet and measure whether people take a real action toward it | Value | Did (a sign-up), or paid (a pre-order) |
| Concierge | Deliver the outcome yourself, by hand and in the open, to a few customers | Value, and whether they keep coming back | Did; paid if you charge |
| Wizard of Oz | Make the product look automated while a person does the work behind the scenes | Value and usability of the real experience | Did |
| Presell | Ask for money or a binding commitment before it exists: a pre-order, a deposit, a signed letter | Value and viability | Paid |
One definition of a smoke test. A smoke test is any offer of a product that does not exist yet, measured by a real action. A landing page with a waitlist and a pre-order page are both smoke tests; they differ in the rung of evidence. A sign-up is did; a pre-order is paid. A fake door is a smoke test inside a product you already have: a button for a feature you have not built, which counts the clicks. Be honest with whoever clicks: tell them it is coming, and thank them.
Three classic cases from Eric Ries’s The Lean Startup (Ries 2011): Dropbox’s smoke test was a short demo video, posted before the product was public, which Ries reports took the beta waiting list from 5,000 to 75,000 people overnight. Food on the Table, a meal-planning service, began as a concierge, its founder planning meals by hand for one customer. And Zappos began as a Wizard of Oz: its founder photographed shoes in local stores and bought a pair at full price whenever someone ordered.
The concierge test is Paul Graham’s “do things that don’t scale” applied to discovery (Graham 2013): doing it by hand teaches you the job in a way no survey can.
Learning per hour is how you choose among them. Ask: which test answers my riskiest assumption, on the highest rung, in the fewest hours? For the dues tracker, a concierge test is the best choice: ask three treasurers to send you their Venmo export each Sunday and send back a “who has paid” list you built by hand. In two weeks you learn whether they send it (did), whether they read the list, and whether they would pay for it, with no code at all.
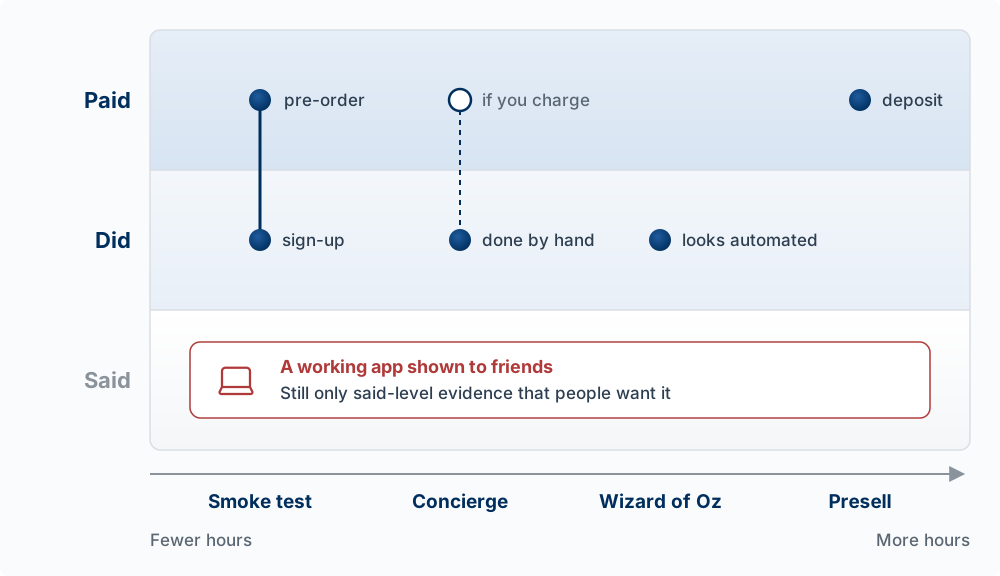
Building is cheap now, so sometimes the build is the cheapest test, especially for usability and feasibility. But a working app tested on friends sits on the said rung for value. Whatever you build, attach a real action (a sign-up, a return visit, a payment) to it.
Smoke test and Wizard of Oz framing from Nile Hatch, Expeditionary Innovation; both are established lean-startup techniques he assembles into the method (Hatch, n.d.).
TipTry it
For your riskiest assumption, design two of the four tests. For each, write what you will do, what action you will count, which rung that action sits on, and how many hours it will take. Predict the result before you run it, and write down what result would make you change your plan. Pick the one with the best learning per hour and run it this sprint.
The Commitment Decision
At some point, you need to stop exploring and start building. This is the commitment decision, choosing one problem to focus on.
Signs you’re ready to commit:
- You’ve talked to 5+ people who experience the problem
- Multiple people show strong signals on frequency, intensity, and willingness to pay, with evidence above the said rung
- You can name the current habit you have to beat
- You have named your riskiest assumption, and a small test has not disproved it
- You’re excited to work on this for months
Signs you’re not ready:
- You’re still finding contradictory information
- Nobody seems to care that much
- You can’t articulate who this is for
- You’re only excited because you like the solution idea
For the dues tracker, ready would look like this: you have talked to five treasurers; three showed you the sign-up sheet they reconcile by hand every Sunday (did); you can name the habit (a Venmo feed and a spreadsheet); and the concierge test from The Smallest Test ran for two Sundays with treasurers sending their exports each week. Not ready would look like this: two treasurers said it sounded useful, and neither has sent you anything.
Avoiding Premature Commitment
The Commitment Decision asks whether you have enough evidence to commit. The more common trap is committing before you do. Watch for these warning signs:
Solution love: You’re attached to a specific solution before validating the problem. (“I want to build an AI app” → wrong starting point)
Confirmation bias: You’re only hearing what supports your hypothesis. Actively seek disconfirming evidence.
Sunk cost: You’ve invested time, so you don’t want to pivot. Cut your losses early. It’s cheaper than building the wrong thing.
Founder fantasy: You imagine the success, not the work. Focus on the problem and the work it takes.
Your Value Proposition
Once you commit to a problem, articulate your value proposition, a clear statement of what you offer and why it matters.
Template:
For [target customer] Who [has this problem] Our product is [category] That [key benefit] Unlike [alternatives] We [key differentiator]
Example:
For marketing managers at mid-size SaaS companies Who spend 6+ hours weekly compiling reports from multiple tools Our product is an automated reporting dashboard That pulls data from all your tools into one real-time view Unlike manual spreadsheets or expensive enterprise solutions We take 10 minutes to set up and cost 1/10th the price
The same template for the dues tracker:
For treasurers of student clubs with fewer than 200 members who collect dues on Venmo Who spend Sunday matching payments to a sign-up sheet Our product is a dues tracker That shows who has paid and who still owes Unlike a Venmo feed and a spreadsheet We match each payment to a member from the Venmo statement you already download
The “For” line is your beachhead. The “Unlike” line names the current habit first (manual spreadsheets in the first example; a Venmo feed and a spreadsheet in the second), because that is what the customer will compare you to.
The canvas below is a second way to check the same statement. On the right, list the customer’s jobs, pains, and gains from your interviews. On the left, list what your product does about each one. Your value proposition is strong when the left side answers the items on the right that matter most to the customer.
What is an MVP?
Once you have committed to a problem and can state your value proposition, the next decision is what to build first.
A Minimum Viable Product is the smallest thing you can put in front of real users that tests your riskiest assumption and generates learning you can act on. Eric Ries, who gave the term its modern use, defines it by how much it teaches you for the least effort (Ries 2011). By that definition the smoke tests and concierge services above are MVPs: the Dropbox video was one. So MVPs range from no code at all to a working product with one core feature.
The keyword viable is about honest signal: whatever you put in front of people has to deliver the experience well enough that their response tells you something. A broken prototype gets polite reactions that tell you nothing.
The MVP and the build-measure-learn loop behind it come from Eric Ries, The Lean Startup (2011) (Ries 2011). The loop still applies, but AI has changed its balance: building is cheap now, so measure and learn, deciding what to build and confirming it worked, now take most of the effort.
Minimum Viable, or Minimum Awesome?
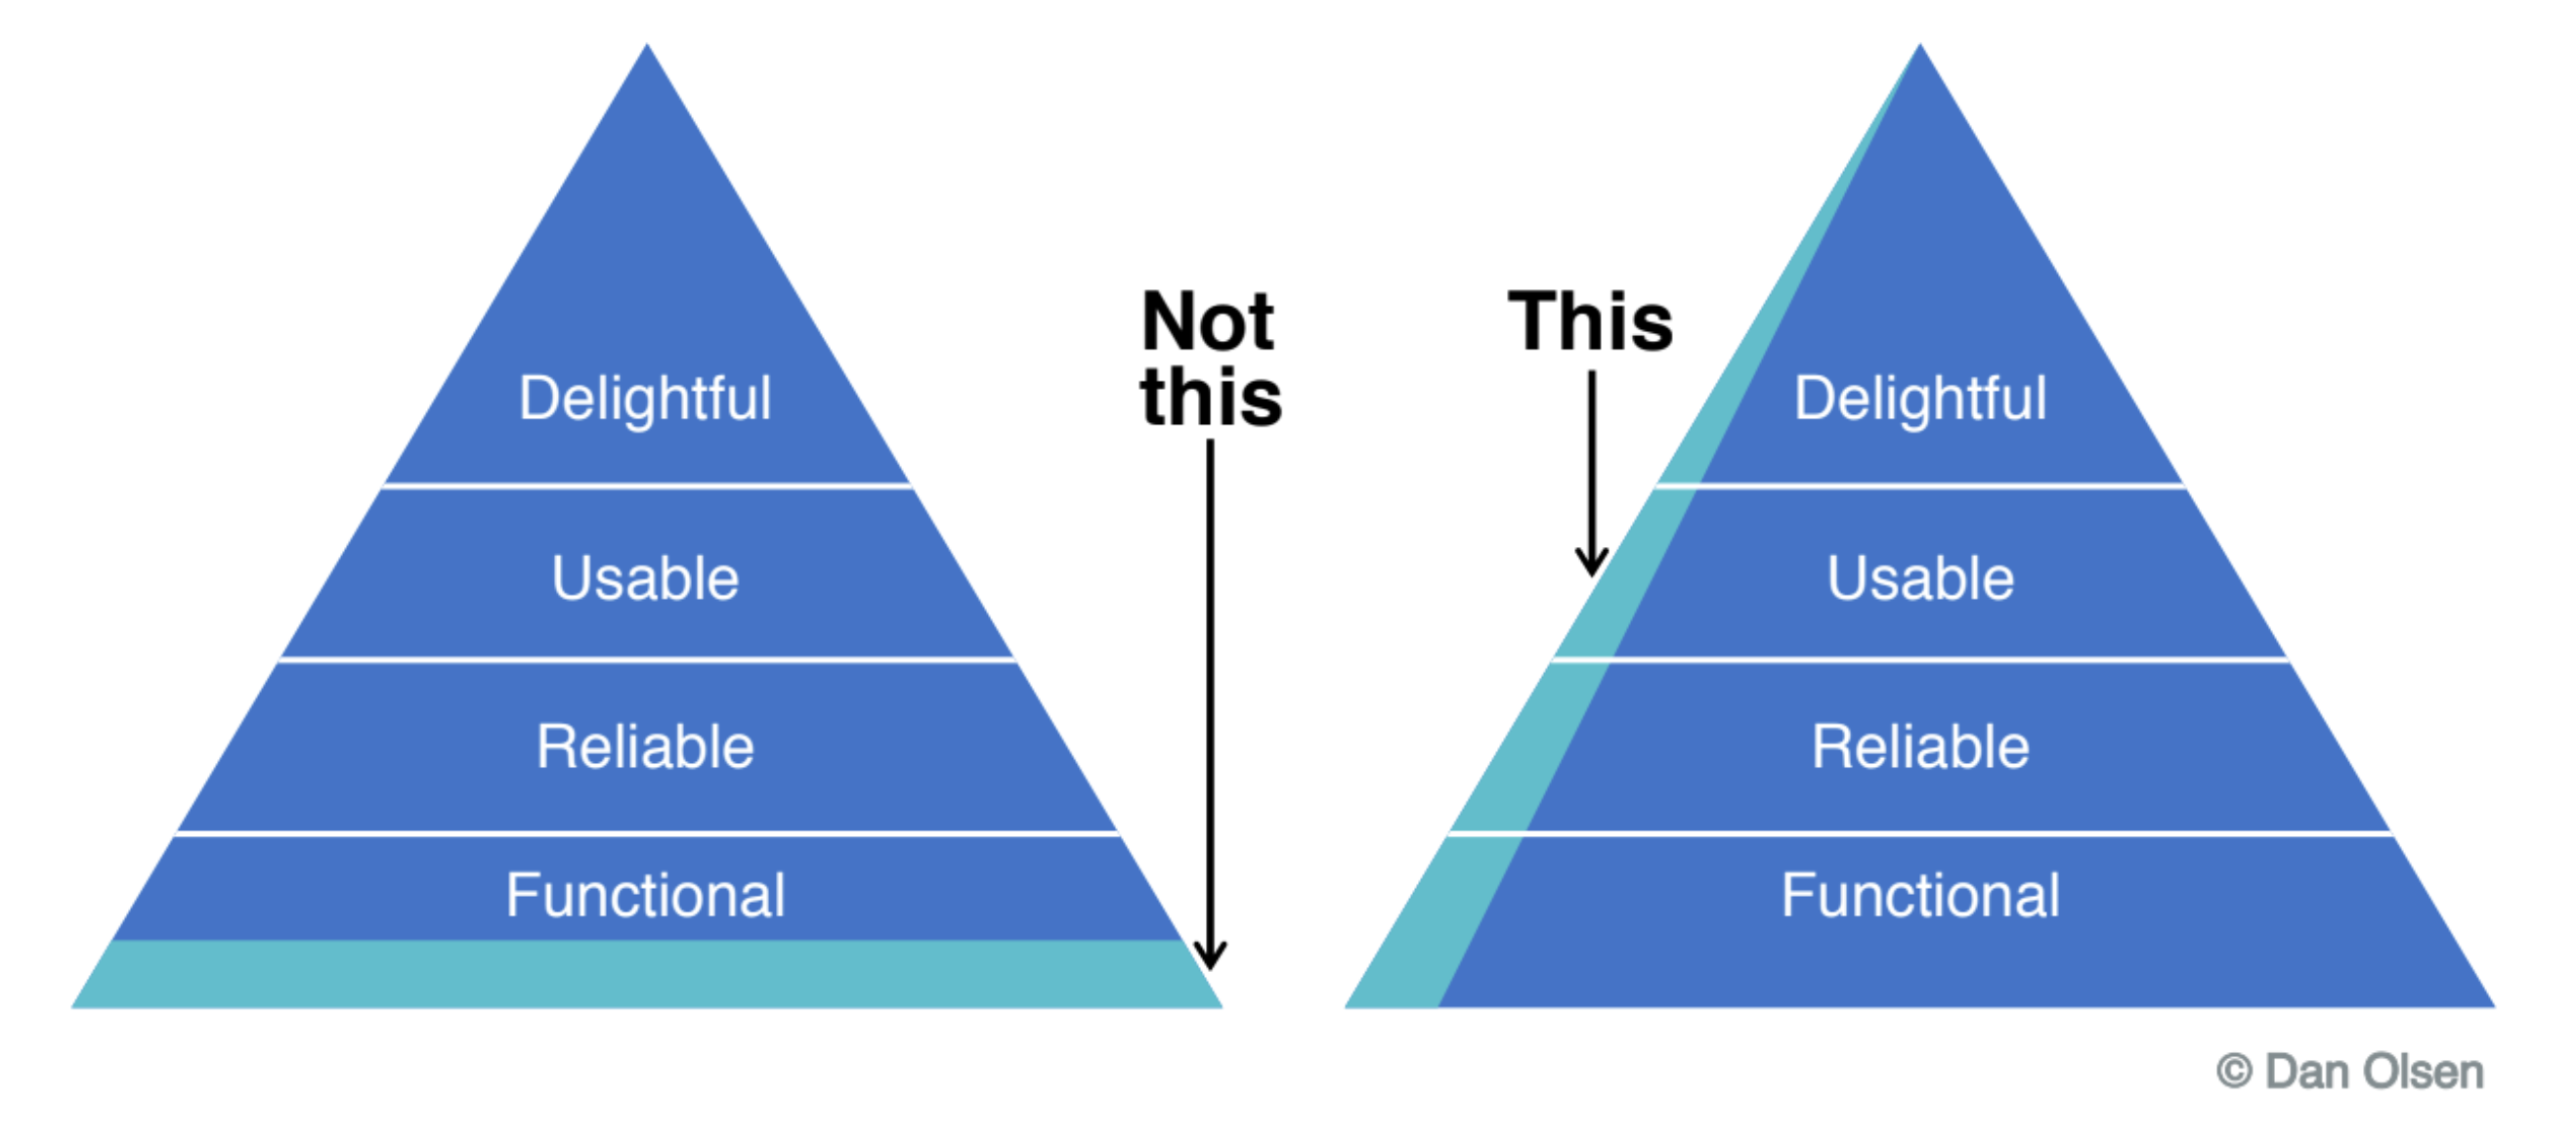
Jeff Dyer and Nathan Furr add one requirement to the MVP. A merely viable product often tests badly: people are polite about something that barely works, so you cannot tell real demand from good manners. They argue instead for a minimum awesome product, still minimal, still one core action, but good enough at that one thing that people are delighted by it. An awesome-at-one-thing product gives you honest signal: people either love it or they do not, which is exactly what you are trying to learn. So cut scope to the minimum, then make what remains excellent.
The minimum awesome product is from Nathan Furr and Jeff Dyer, The Innovator’s Method (Harvard Business Review Press, 2014) (Furr and Dyer 2014).
MVP Scoping: Deciding What to Cut
Most founders include too much in their MVP. They think “just one more feature” will make it viable. It usually does not. Every feature adds:
- Development time
- Testing complexity
- User confusion
- Things that can break
The MVP question: What is the one thing users must be able to do? Everything else is optional.
The Single-Feature MVP
The best MVPs often do exactly one thing:
| Product | MVP | What They Didn’t Build Yet |
|---|---|---|
| Dropbox | A demo video of file sync (a smoke test, before the product was public) | The public product itself, then mobile apps, sharing, teams |
| Post 140-character updates | Retweets, media, DMs | |
| Airbnb | List your spare room | Payments, reviews, insurance |
| Stripe | Accept credit cards | Invoices, subscriptions, fraud detection |
What’s the one thing your product must do?
Feature vs. Product Thinking
Feature thinking: “We need user profiles, notifications, settings, admin panel, analytics…”
Product thinking: “Users need to accomplish X. What’s the minimum to enable that?”
Start with the outcome, not the feature list.
Feature Prioritization
You’ll always have more ideas than time. Use frameworks to prioritize.
The ICE Framework
Score each feature 1-10 on:
| Factor | Question |
|---|---|
| Impact | How much will this improve the user experience? |
| Confidence | How sure are we this will work? |
| Effort | How much time will this take? |
ICE Score = Impact × Confidence / Effort
Higher scores = higher priority.
MoSCoW Method
Categorize features as (Clegg and Barker 1994):
| Category | Meaning |
|---|---|
| Must have | MVP fails without this |
| Should have | Important but MVP works without it |
| Could have | Nice to have if time permits |
| Won’t have | Explicitly out of scope (for now) |
Be honest about what is “must have.” Most features are “should have” at best.
The $100 Test
The $100 Test is a fast way to force prioritization. Imagine you have exactly $100 to “spend” across your candidate features. You must allocate all of it, and you cannot spread it evenly. Put the money where the value is. The features that attract real dollars are your MVP; the ones that get a few cents are not.
It works because it forces trade-offs that a flat must / should / could list lets you avoid: you feel the cost of every feature you fund. Run it on yourself, and better, run it with a few target users and watch where they put the money.
The $100 Test is from Nile Hatch, Expeditionary Innovation (Hatch, n.d.).
From Discovery to the Brief
The model: discovery ends in a one-page brief: who it is for, what problem, what done looks like, and what is out. The same page is the shared contract with a client and the prompt for your agent.
Each line comes straight from this chapter:
| Brief line | Where it comes from |
|---|---|
| Who | Your beachhead, the not-for list, and the user and payer |
| Problem | The job statement and your synthesis, with the evidence rung for each claim |
| Done looks like | The observable result that would show the riskiest assumption held (for example, “3 of 5 treasurers use the list two Sundays in a row”) |
| Out | Everything the “so what” test and MVP scoping cut |
An agent given only “build a dues tracker” fills every blank with a guess, and its guesses come from the average app it has seen. The brief replaces those guesses with your evidence. Chapter 6b covers how to turn it into user stories and a PRD the agent builds from.
Discovery Is Continuous
Discovery is not a phase you finish before building. The best product teams keep talking to customers every week, indefinitely. Teresa Torres calls this continuous discovery, and it fits this course exactly: you run the loop again every sprint, not once at the start.
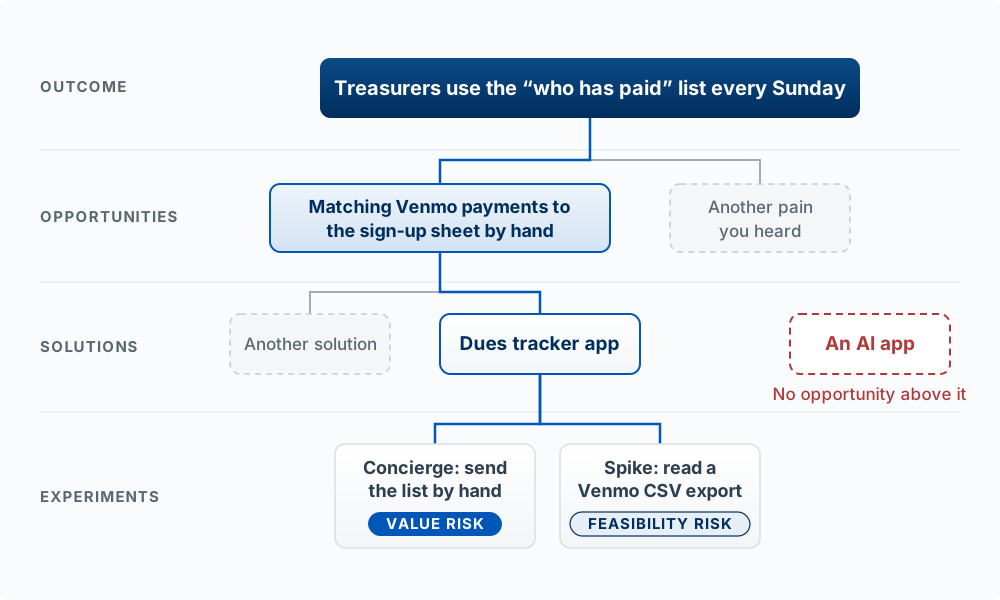
She also gives a way to keep discovery organized, the Opportunity Solution Tree. Start from one desired outcome (the thing you want to move). Branch into the opportunities: the specific customer needs and pains you have discovered that could move it. Under each opportunity, branch into candidate solutions, and under each solution, the experiments that would test it. The tree enforces a rule: every solution has to sit under an opportunity you actually discovered, or it does not belong on the tree.
The pieces of this chapter fit on that tree. Each experiment tests one assumption behind a solution, usually your riskiest, and each is tagged by one of the four risks. The smallest tests above are your experiments (Figure 8.11).
Continuous discovery and the Opportunity Solution Tree are from Teresa Torres, Continuous Discovery Habits (2021) (Torres 2021).
Key Concepts
- Discovery: finding out which of your beliefs about other people are true, cheaply, before you spend a sprint building on them.
- Product-market fit and the Lean Product Process (Dan Olsen): you have built something that meets a real need of a real group of customers better than what they use now. The target customer and underserved needs are the market, which you discover; the value proposition, feature set, and UX are the product, which you choose.
- Belief versus truth: six regions of a map of what you believe, what is true, and how much evidence you have. The most dangerous is False Confidence (sure, and wrong); the most common miss is Available but Unseen (true, and one interview away).
- Triangulation and thinking in probabilities: every way of knowing can mislead, so treat a belief as validated only when independent sources agree, and hold beliefs as probabilities. Good evidence would look different if you were wrong.
- The five discovery skills (Dyer, Gregersen, and Christensen): questioning, observing, networking, experimenting, and associating. They are mostly learned through practice.
- You are your best first customer: your own frustrations give fast feedback and real insight, but you are one data point.
- Problem journal: a running record of every moment of friction you notice, captured without filtering.
- Diverge before you converge: generate many candidate problems before judging any, then narrow deliberately. Seizing the first idea is premature convergence.
- Jobs-to-be-Done (JTBD): people hire a product to make progress in a specific situation. Write the job (when I’m [situation], I want to [motivation], so I can [outcome]) with no product or feature in it.
- Functional, emotional, and social jobs: what they want to accomplish, how they want to feel, and how they want to be seen.
- Journey map: the whole job mapped phase by phase, with what the person does, thinks, and feels. The dips show where the pain is greatest and where the opportunities are.
- Five kinds of pain: physical, functional, financial, emotional, and social. The pains people mention first are usually functional; the ones that drive them to pay are often emotional or social.
- The real competitor is the current habit: your main competitor is whatever the person does today. They switch only when push plus pull outweighs anxiety plus habit (Moesta’s forces of progress).
- The Mom Test (Rob Fitzpatrick): talk about their life instead of your idea, ask about specific past events instead of hypothetical futures, and listen more than you talk. The most useful question: “Walk me through the last time you experienced this problem.”
- The evidence ladder: said, did, paid. Each rung costs the person more to fake, so it counts for more. The past is on the did rung and the future is on the said rung; tag every claim by its rung.
- Interview synthesis: a validated problem statement, who you talked to, key insights each tagged with its evidence rung, quotes, and next steps. Stop interviewing when new interviews stop surprising you.
- Beachhead and not-for: a narrow first segment you can win completely and expand from (Geoffrey Moore), plus a stated list of who you are not serving.
- User versus payer: the person who uses the product and the person who pays for it may differ. If they do, you need evidence from both.
- The access test: location, engagement, and reciprocity. If you cannot reach a segment cheaply now, find a reachable beachhead or reconsider the problem.
- Persona: a fictional but realistic customer built from interview evidence you already have. A persona generated before you talk to anyone contains no information.
- Evaluating problems: score frequency, intensity, willingness to pay, and market size, then check your fit (conviction) and addressability. The strongest case is frequent and painful and people will pay.
- Importance versus satisfaction (Dan Olsen): the opportunity is a need that matters a lot and is poorly met by current solutions.
- MECE and issue trees: break a question into parts that do not overlap and leave nothing out, splitting until every leaf can be checked with evidence. Work first on the branch with high impact, high uncertainty, and testability, and skip any question that fails the “so what” test.
- What would have to be true: turn an idea into a list of specific conditions, each of which you can test (Roger Martin).
- The four risks (Marty Cagan): value, usability, feasibility, and viability. Teams over-test feasibility and under-test value, and a working app proves only that you could build it.
- Riskiest assumption: the condition that is both most uncertain and most fatal if false. Test it before anything else.
- The smallest test: smoke test, concierge, Wizard of Oz, or presell. Choose by learning per hour: the highest evidence rung on your riskiest assumption for the fewest hours.
- The commitment decision: when to stop exploring and choose one problem: five or more interviews, signals above the said rung, a named habit to beat, and a riskiest assumption a small test has not disproved.
- Avoiding premature commitment: watch for solution love, confirmation bias, sunk cost, and founder fantasy.
- Value proposition: for [customer], who [problem], our product is [category] that [benefit], unlike [alternatives], we [differentiator]. The “For” line is your beachhead, and the “Unlike” line names the current habit first.
- Value Proposition Canvas (Osterwalder and others): fit is when your pain relievers and gain creators answer the customer’s jobs, pains, and gains that matter most.
- MVP (Eric Ries): the smallest thing you can put in front of real users that tests your riskiest assumption and generates learning you can act on. It can be anything from a smoke test to a working product with one core feature.
- Minimum awesome product (Furr and Dyer): cut scope to the minimum, then make what remains excellent, so people’s reactions give honest signal.
- MVP scoping: ask what is the one thing users must be able to do; everything else is optional.
- Feature prioritization: ICE (impact × confidence / effort), MoSCoW (must, should, could, won’t), and the $100 test.
- The brief: who it is for, the problem, what done looks like, and what is out. It is the shared contract with a client and the prompt for your agent.
- Continuous discovery and the Opportunity Solution Tree (Teresa Torres): keep talking to customers every sprint. The tree runs outcome, opportunities, solutions, experiments, and every solution must sit under an opportunity you actually discovered.