
The Logic of Value
This is the economics underneath the value stick. The strategy chapter uses the value stick as a teaching picture: willingness to pay at the top, willingness to sell at the bottom, create versus capture in between. This appendix derives the picture. It shows that producer surplus, accounting profit, economic profit, and the finance world’s ROIC minus WACC are not four different ideas from four different disciplines. They are one idea, seen at four levels of cost recognition, and they connect all the way up to the consumer’s willingness to pay.
It goes into more detail than the course needs. It is here as reference for anyone who wants the full derivation, and as the first of a set of standalone pieces that may later become chapters of a separate book on the logic of value.
One idea, four disciplines
Accounting, economics, finance, and strategy each have their own word for roughly the same thing. Accountants speak of profit. Economists speak of surplus. Financiers speak of returns above the cost of capital. Strategists speak of value creation and capture. These are usually taught in separate courses, by separate departments, out of separate textbooks, as if they were separate subjects. They are not. They are successive refinements of a single quantity, distinguished only by which costs each one is willing to recognize.
Start with the most permissive measure and subtract your way down.
\[ \begin{aligned} \text{Producer Surplus} &= \text{Revenue} - \text{Variable Costs} \\[4pt] \text{Accounting Profit} &= \text{Revenue} - \text{Explicit Costs (variable} + \text{fixed)} \\[4pt] \text{Economic Profit} &= \text{Revenue} - (\text{Explicit} + \text{Implicit Costs}) \\[4pt] \text{Financial Economic Profit} &= (\text{ROIC} - \text{WACC}) \times \text{Invested Capital} \end{aligned} \]
Each line recognizes one more cost than the line above it. Producer surplus recognizes only variable costs. Accounting profit adds fixed costs. Economic profit adds the implicit opportunity cost of the owners’ capital. Financial economic profit expresses that same opportunity cost as a required return on invested capital, so that the residual is stated in the language investors use.
| Measure | Definition | Costs subtracted | Discipline |
|---|---|---|---|
| Producer surplus | Revenue − variable costs | Only variable | Microeconomics |
| Accounting profit | Revenue − explicit costs | Explicit (cash) | Accounting |
| Economic profit | Revenue − (explicit + implicit) | All, including opportunity cost | Economics / strategy |
| Financial EP | (ROIC − WACC) × capital | Opportunity cost of capital as WACC × capital | Finance / strategy |
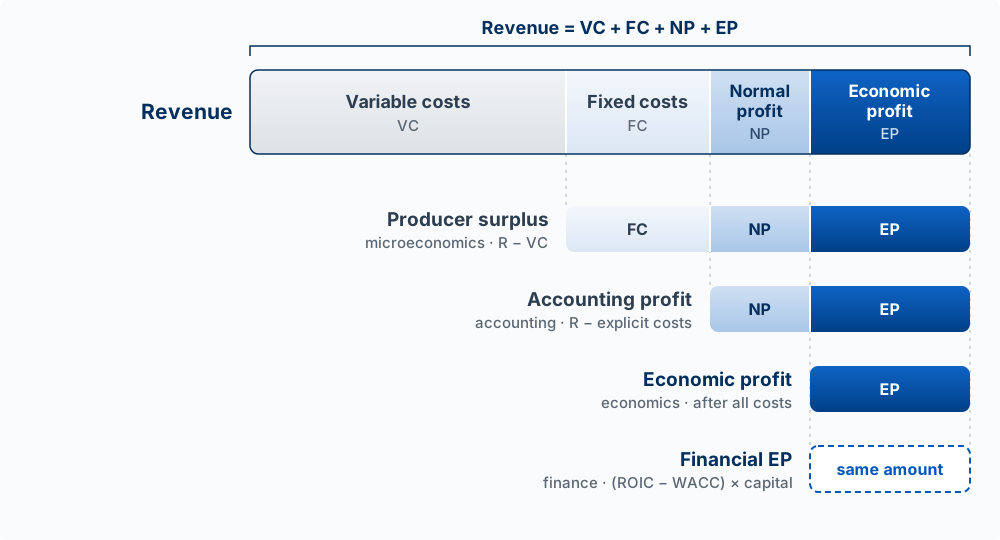
The rest of this appendix goes through the continuum in order: what producer surplus actually measures, the three claims that reduce it, the same fact read as a waterfall of revenue, and finally the consumer side, which connects back to the value stick.
What producer surplus actually measures
For a single firm producing \(Q^*\) units at price \(P^*\), producer surplus is the area between price and the marginal cost curve, summed over output:
\[ PS = \int_0^{Q^*} \left[ P^* - MC(q) \right] \, dq = R - VC \]
This is a real flow of economic value, not a welfare abstraction. Every unit sold contributes its price above the marginal cost of making it, and those contributions sum to the amount the firm has to work with. But it is worth being careful about two things it is often confused with.
It is not the market welfare triangle. The clean triangle in an economics textbook is drawn on a market supply-and-demand graph, and its area is the surplus of all producers together. For one firm the shape is usually not a triangle at all, and the number is not social welfare. It is that firm’s own short-run operating surplus.
It is not yet profit. Producer surplus is revenue minus variable costs only. Fixed costs and the cost of capital have not been taken out. So the relationship is:
\[ \text{Accounting Profit} = PS - FC \]
Producer surplus is necessary for profit but not sufficient. Profit is what remains of it after further costs are subtracted. If fixed costs exceed producer surplus, the firm generated real surplus and still lost money.
The three claims on producer surplus
If producer surplus is the amount to be divided, the natural question is who has a claim on it. There are three claimants, in order of priority:
\[ \underbrace{PS}_{\text{value created}} = \underbrace{FC}_{\text{fixed factors}} + \underbrace{NP}_{\text{normal return to capital}} + \underbrace{EP}_{\text{residual value captured}} \]
- Fixed costs (FC) are the payments required to keep productive capacity in place: plant, equipment, salaried staff, rent, depreciation.
- Normal profit (NP) is the implicit cost of the owners’ own capital and effort, the return they could have earned elsewhere at similar risk. It is a cost, not a gain, even though it never appears on an income statement.
- Economic profit (EP) is whatever is left after both. It is the only tier that represents value genuinely captured above every cost, explicit and implicit.
This decomposition is not standard textbook framing, and the whole synthesis depends on it. It is what makes the perfect-competition result intuitive. In long-run competitive equilibrium, entry drives economic profit to zero, but producer surplus stays strictly positive:
\[ EP = 0 \quad \Longrightarrow \quad PS = FC + NP \]
The surplus is still there. It all goes to fixed costs and the normal return to capital, with nothing left over. Two facts that sound contradictory are both true at once here: economic profit is zero, and accounting profit is positive. They coexist because accounting profit is exactly the normal return, the implicit cost that accounting never books:
\[ EP = \Pi_A - NP = 0 \quad \Longrightarrow \quad \Pi_A = NP \]
A firm in competitive equilibrium earns positive accounting profit, just enough to compensate its owners for the opportunity cost of their capital, and no more.
The same fact as a waterfall of revenue
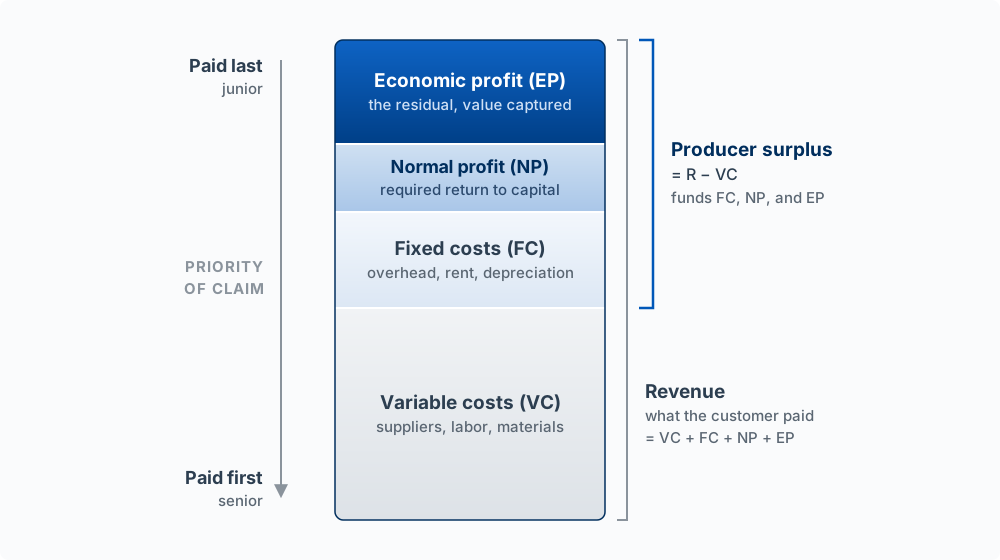
The decomposition above starts from surplus and asks what reduces it. Flip it. Start from revenue and ask who gets paid, and the identity rearranges into a waterfall:
\[ R = VC + FC + NP + EP \]
Read top to bottom, this is a priority stack, the same structure a financier would recognize from a capital structure.
- Variable costs are paid first. Suppliers, labor, and materials. If they are not covered, production stops. This is the senior claim.
- Fixed costs are paid next. Overhead, leases, depreciation. They must be covered to keep capacity in place.
- Normal profit comes next. The return required to keep capital invested at all. In a competitive long run this tier is fully funded and no more.
- Economic profit is the residual. Junior, uncertain, and the only tier with real upside. It is what is left after every prior claim is satisfied, and it exists only where the firm has an advantage the market cannot compete away.
Every dollar of revenue goes to one of these four tiers. Profit, correctly understood, is simply the residual claim once everyone ahead of it in line has been paid. Divide through by revenue and each term becomes the share of every sales dollar going to that claimant, an economic income statement in proportional terms.
\[ 1 = \frac{VC}{R} + \frac{FC}{R} + \frac{NP}{R} + \frac{EP}{R} \]
One condition applies to the whole chain. The firm produces at all only when price covers average variable cost. Below the shutdown point the firm makes nothing, and every term is zero.
\[ P \ge AVC \quad \Longrightarrow \quad Q^* > 0 \quad \Longrightarrow \quad PS = R - VC \]
Closing the loop: the consumer side
Everything so far is the producer’s side of the market. It stops at revenue, which is what the customer actually paid. But the customer was often willing to pay more, and that gap is value too. In welfare economics the total value created by a trade is split between the two sides:
\[ \text{Total Surplus} = \underbrace{CS}_{\text{consumer surplus}} + \underbrace{PS}_{\text{producer surplus}} \]
where consumer surplus is willingness to pay minus price, and producer surplus is price minus variable cost. So producer surplus is not the total value created. It is the producer’s share of it. Substitute the producer waterfall back in and the whole thing combines into a single identity that runs from the customer’s willingness to pay all the way down to the firm’s residual:
\[ WTP = VC + FC + NP + EP + CS \]
Read left to right, it traces a dollar of value from start to finish: it originates in the consumer’s willingness to pay, is realized as revenue at the point of sale, covers the firm’s variable and fixed costs and the required return on its capital, and terminates in economic profit, with whatever the customer did not have to pay retained as consumer surplus. The value the firm and its customer share, the part that does not go to covering costs or normal returns, is:
\[ \text{Value Created} = CS + EP \]
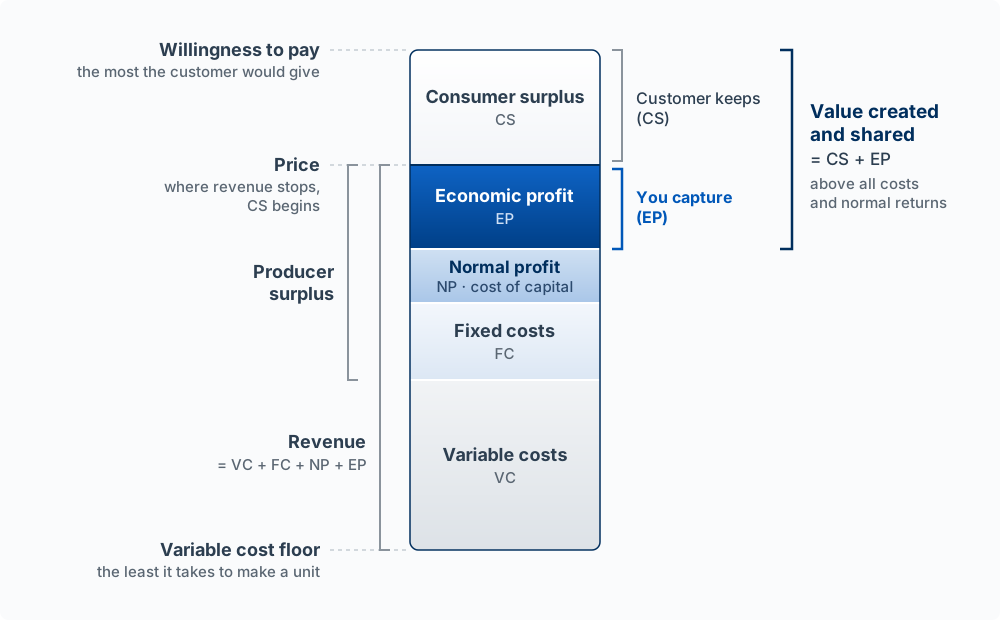
This is exactly the value stick, now derived rather than drawn. The full height of the stick, willingness to pay down to willingness to sell, is \(CS + EP\) plus the normal returns that any firm would require. The interior lines that the strategy chapter draws by hand, price and cost, are where \(CS\), \(EP\), and the supplier’s share meet.
Where strategy enters
This framework makes the role of strategy precise. Operations and finance decide how efficiently a firm creates value, how low it can push \(VC\) and \(FC\), how little capital it can tie up. None of that determines whether the firm keeps any of the value it creates. That is set entirely by the economic profit tier, and the economic profit tier is set by market power.
In perfect competition, \(EP \to 0\). The whole gap goes to customers and suppliers, and the firm keeps only its normal return. Strategy is the discipline of creating and defending an advantage, through differentiation, cost advantage, network effects, brand, or genuine innovation, that lets a firm hold price up toward willingness to pay and sustain \(EP > 0\) over time. This is why the strategy chapter reads Porter’s five forces as a diagnostic of exactly one thing: how wide the economic profit band is that the industry will let you keep.
The framework also clarifies two familiar strategic moves.
Red ocean versus blue ocean (Kim and Mauborgne 2005) is redistribution versus expansion. In a fixed market, total surplus is fixed, and competition is a fight over how the existing \(CS + PS\) is divided. A firm can push for more producer surplus at rivals’ expense, or convert consumer surplus into economic profit by raising price toward willingness to pay. Both are redistributive, moving the interior lines of the stick without changing its height. Blue ocean, in this language, is a shift of the frontier itself: value innovation that lifts willingness to pay and cuts cost at the same time, enlarging total surplus rather than redividing it.
Schumpeter’s creative destruction (Schumpeter 1942) is the dynamic version. Positive economic profit is a signal that attracts entry and imitation, which is precisely the force that competes \(EP\) back toward zero. The firm’s answer is to keep moving the frontier, to keep creating new surplus faster than the old surplus is competed away. Economic profit, in this view, is never permanent. It is a temporary rent that strategy exists to renew.
Where this sits
None of the individual pieces here are new. What is uncommon is putting them in one chain. Marshall gave us the geometry of consumer and producer surplus but never tied it to the accounting statements (Marshall 1890). Brandenburger and Stuart gave us value created as willingness to pay minus willingness to sell, and value captured as the firm’s slice of it, but framed it as bargaining rather than as a cost decomposition (Brandenburger and Stuart 1996). Oberholzer-Gee turned that into the value stick used to teach it (Oberholzer-Gee 2021). The finance literature operationalized the residual tier as economic value added, ROIC minus WACC times capital, but treated it as a purely financial metric unconnected to surplus (Stewart 1991). Porter built strategy around sustaining ROIC above WACC without linking it back to welfare economics (Porter 1980). Teece and Thiel emphasized that creating value and capturing it are separate problems (Teece 1986; Thiel and Masters 2014).
The single identity, \(WTP = VC + FC + NP + EP + CS\), connects these pieces. It shows that the same quantity called surplus by economists, profit by accountants, return above cost of capital by financiers, and value captured by strategists is one continuous thing, measured at different levels, connecting willingness to pay to the firm’s income statement, its capital structure, and competitive advantage. The mathematics is not new. What this appendix adds is the single chain, and the rest of these pieces will build on it.